By Tejas MDAlmost immediately after Nifty 50hit an all-time high on January 5, it lost steam and fell for the next five trading sessions. No prizes for guessing why: it was another of Trump’s tariff tantrums, which have effectively become India’s new macro risk index.
FY26 feels like a tug-of-war between fundamentals on one side and trade threats on the other. The newly arrived US Ambassador to India, Sergio Gor, tried to calm everyone's nerves by calling India an “essential partner,” which sparked a brief bounce on Monday. But he was undermined the very next day, when President Trump threatened a 25% tariff on any nation trading with Iran, putting all ongoing trade talks with countries from China to South Korea to India in jeopardy.
Trump has become a source of intraday volatility that even corporate earnings can’t compete with.
Call me old-school. The real challenge for me is not the tariff drama, but figuring out which Indian companies will keep their momentum going with strong Q3 numbers. Let’s find out.

The Q3 frontrunners: Analysts pick their top five
We shortlist five stocks from the Nifty 500 that are expected to post high revenue and net profit growth YoY and QoQ in Q3FY26 results, according to Trendlyne’s Forecaster. These companies have already set the bar high with strong Q2 results.
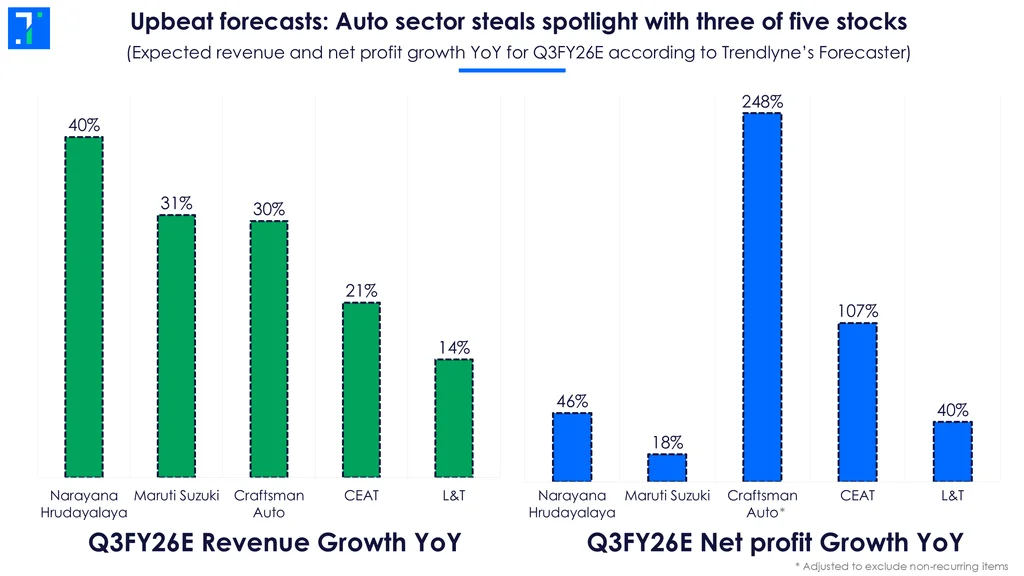
The auto sector is looking strong here, with three of five stocks — Maruti Suzuki, Craftsman Automation and CEAT. The other two stocks are Narayana Hrudayalaya and Larsen & Toubro.
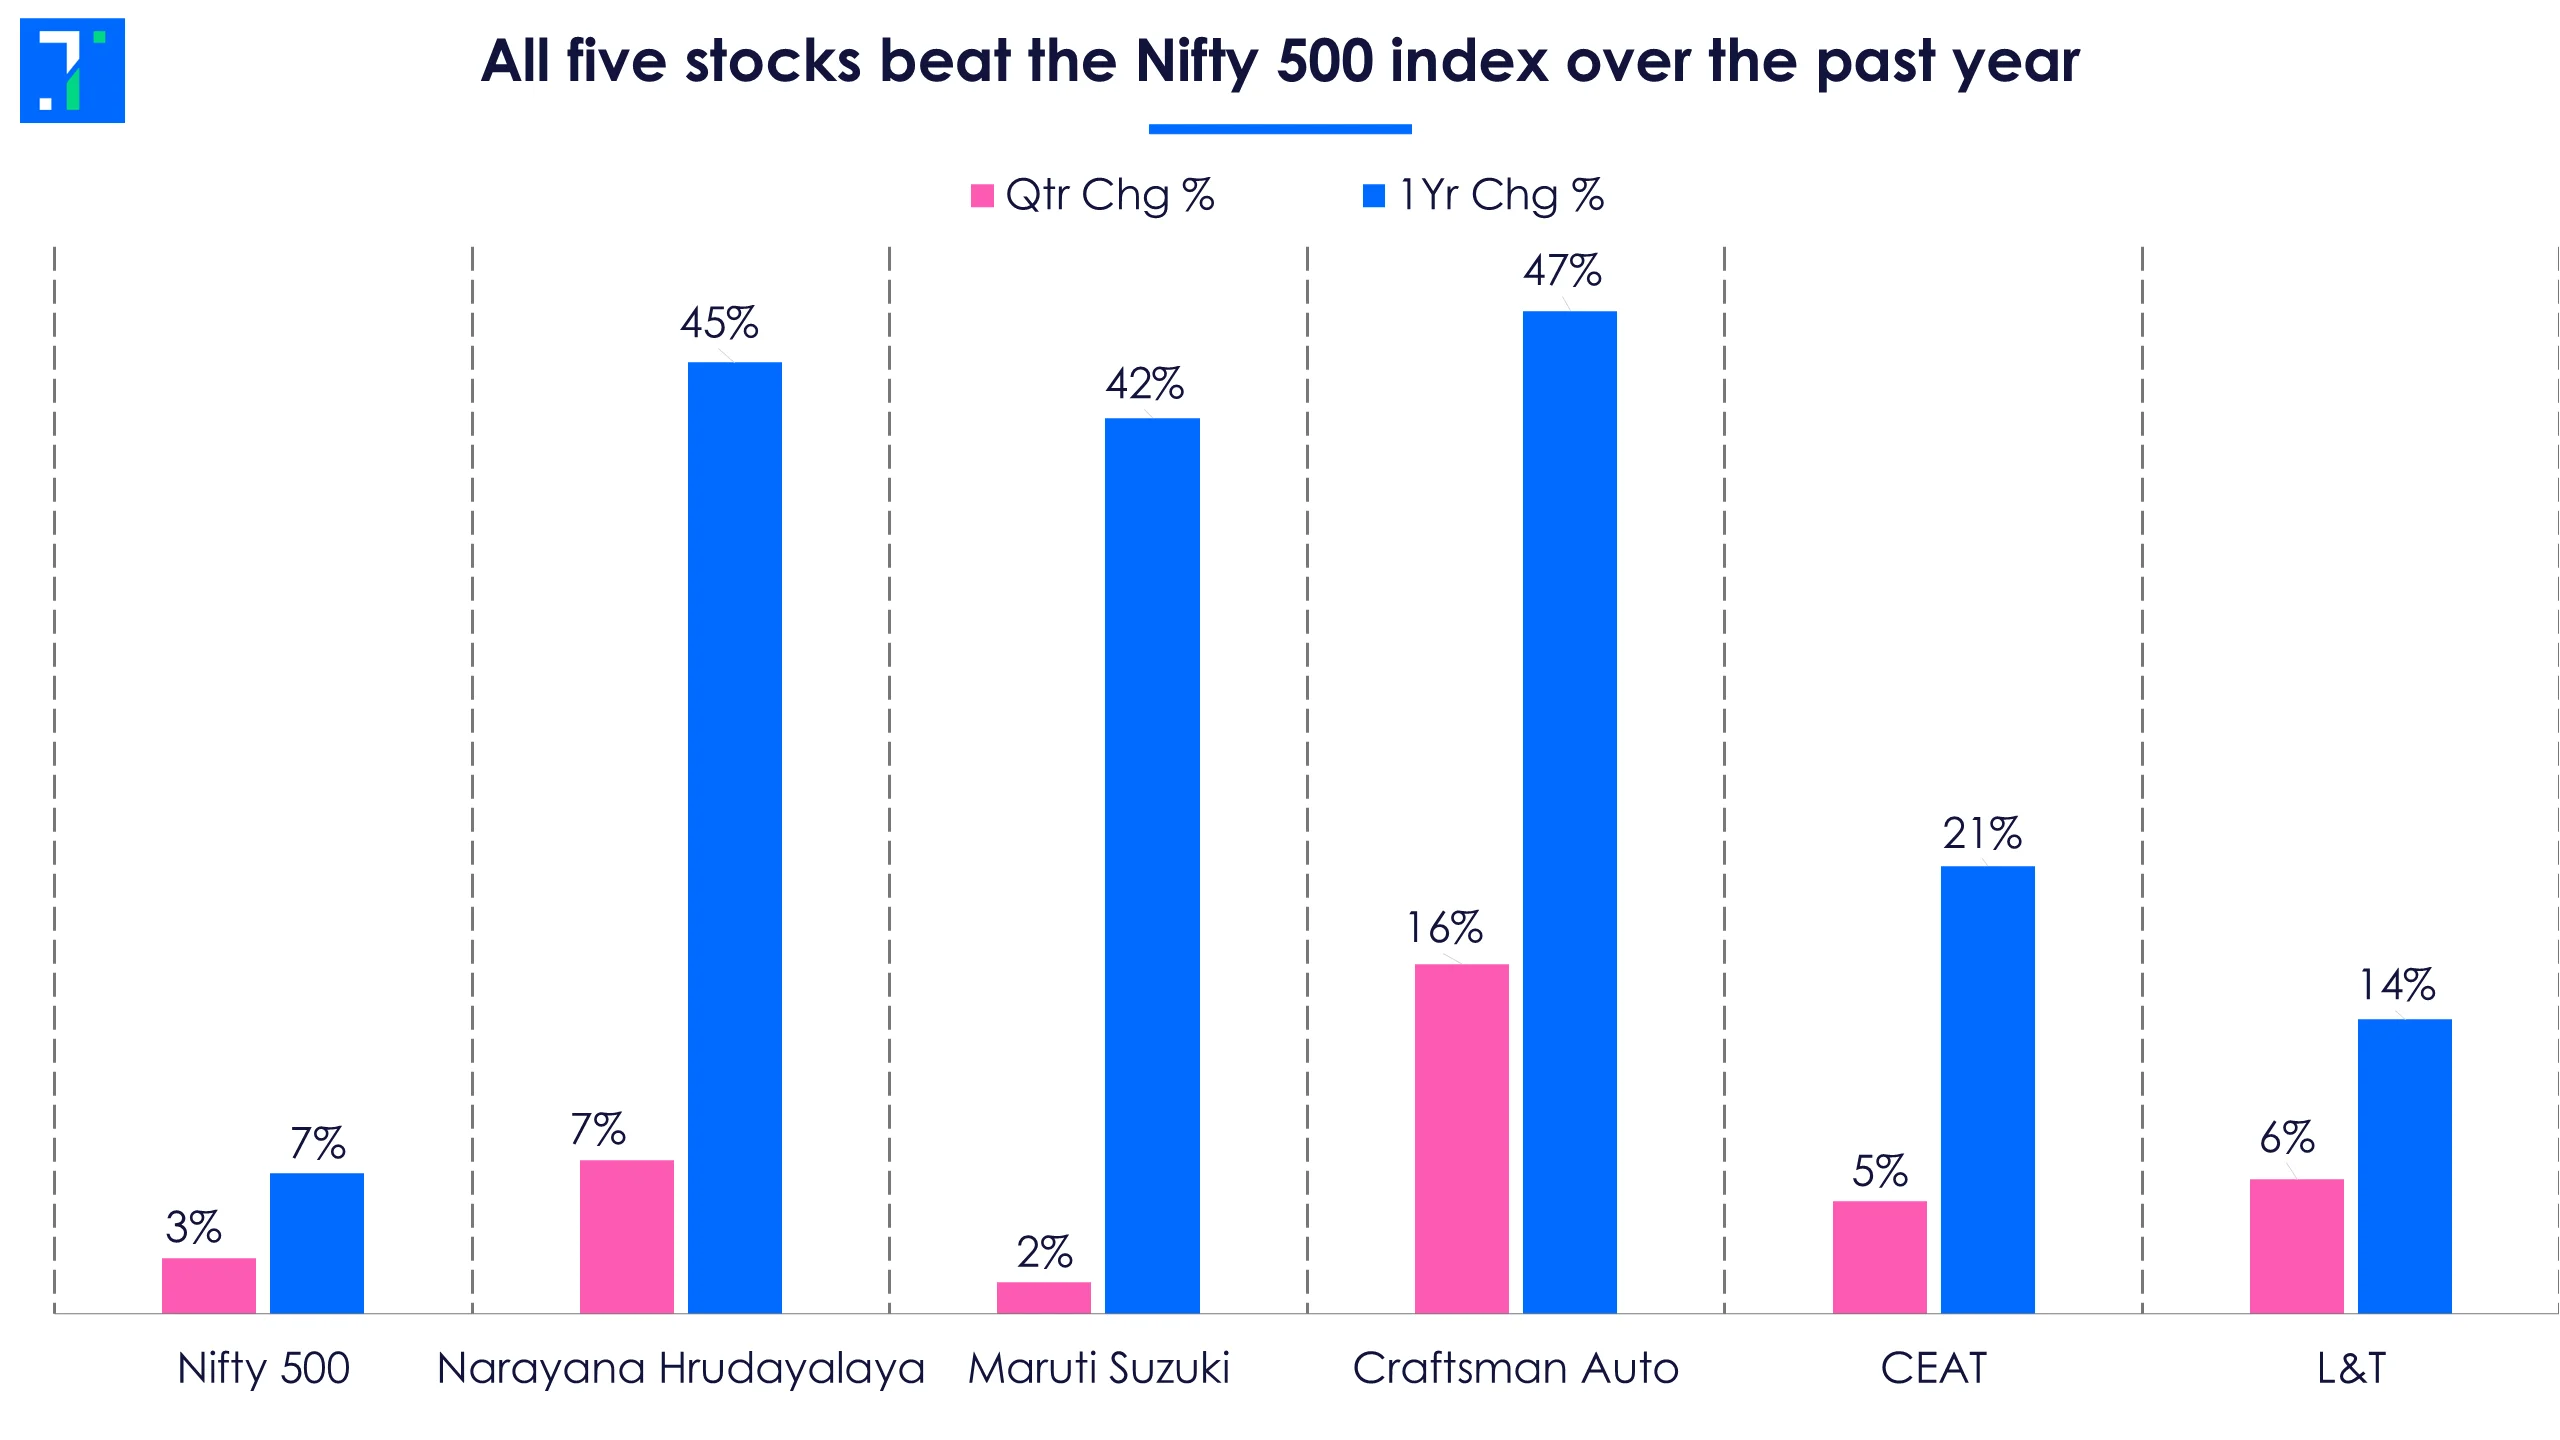
All five stocks have outpaced the Nifty 500 over the past year.
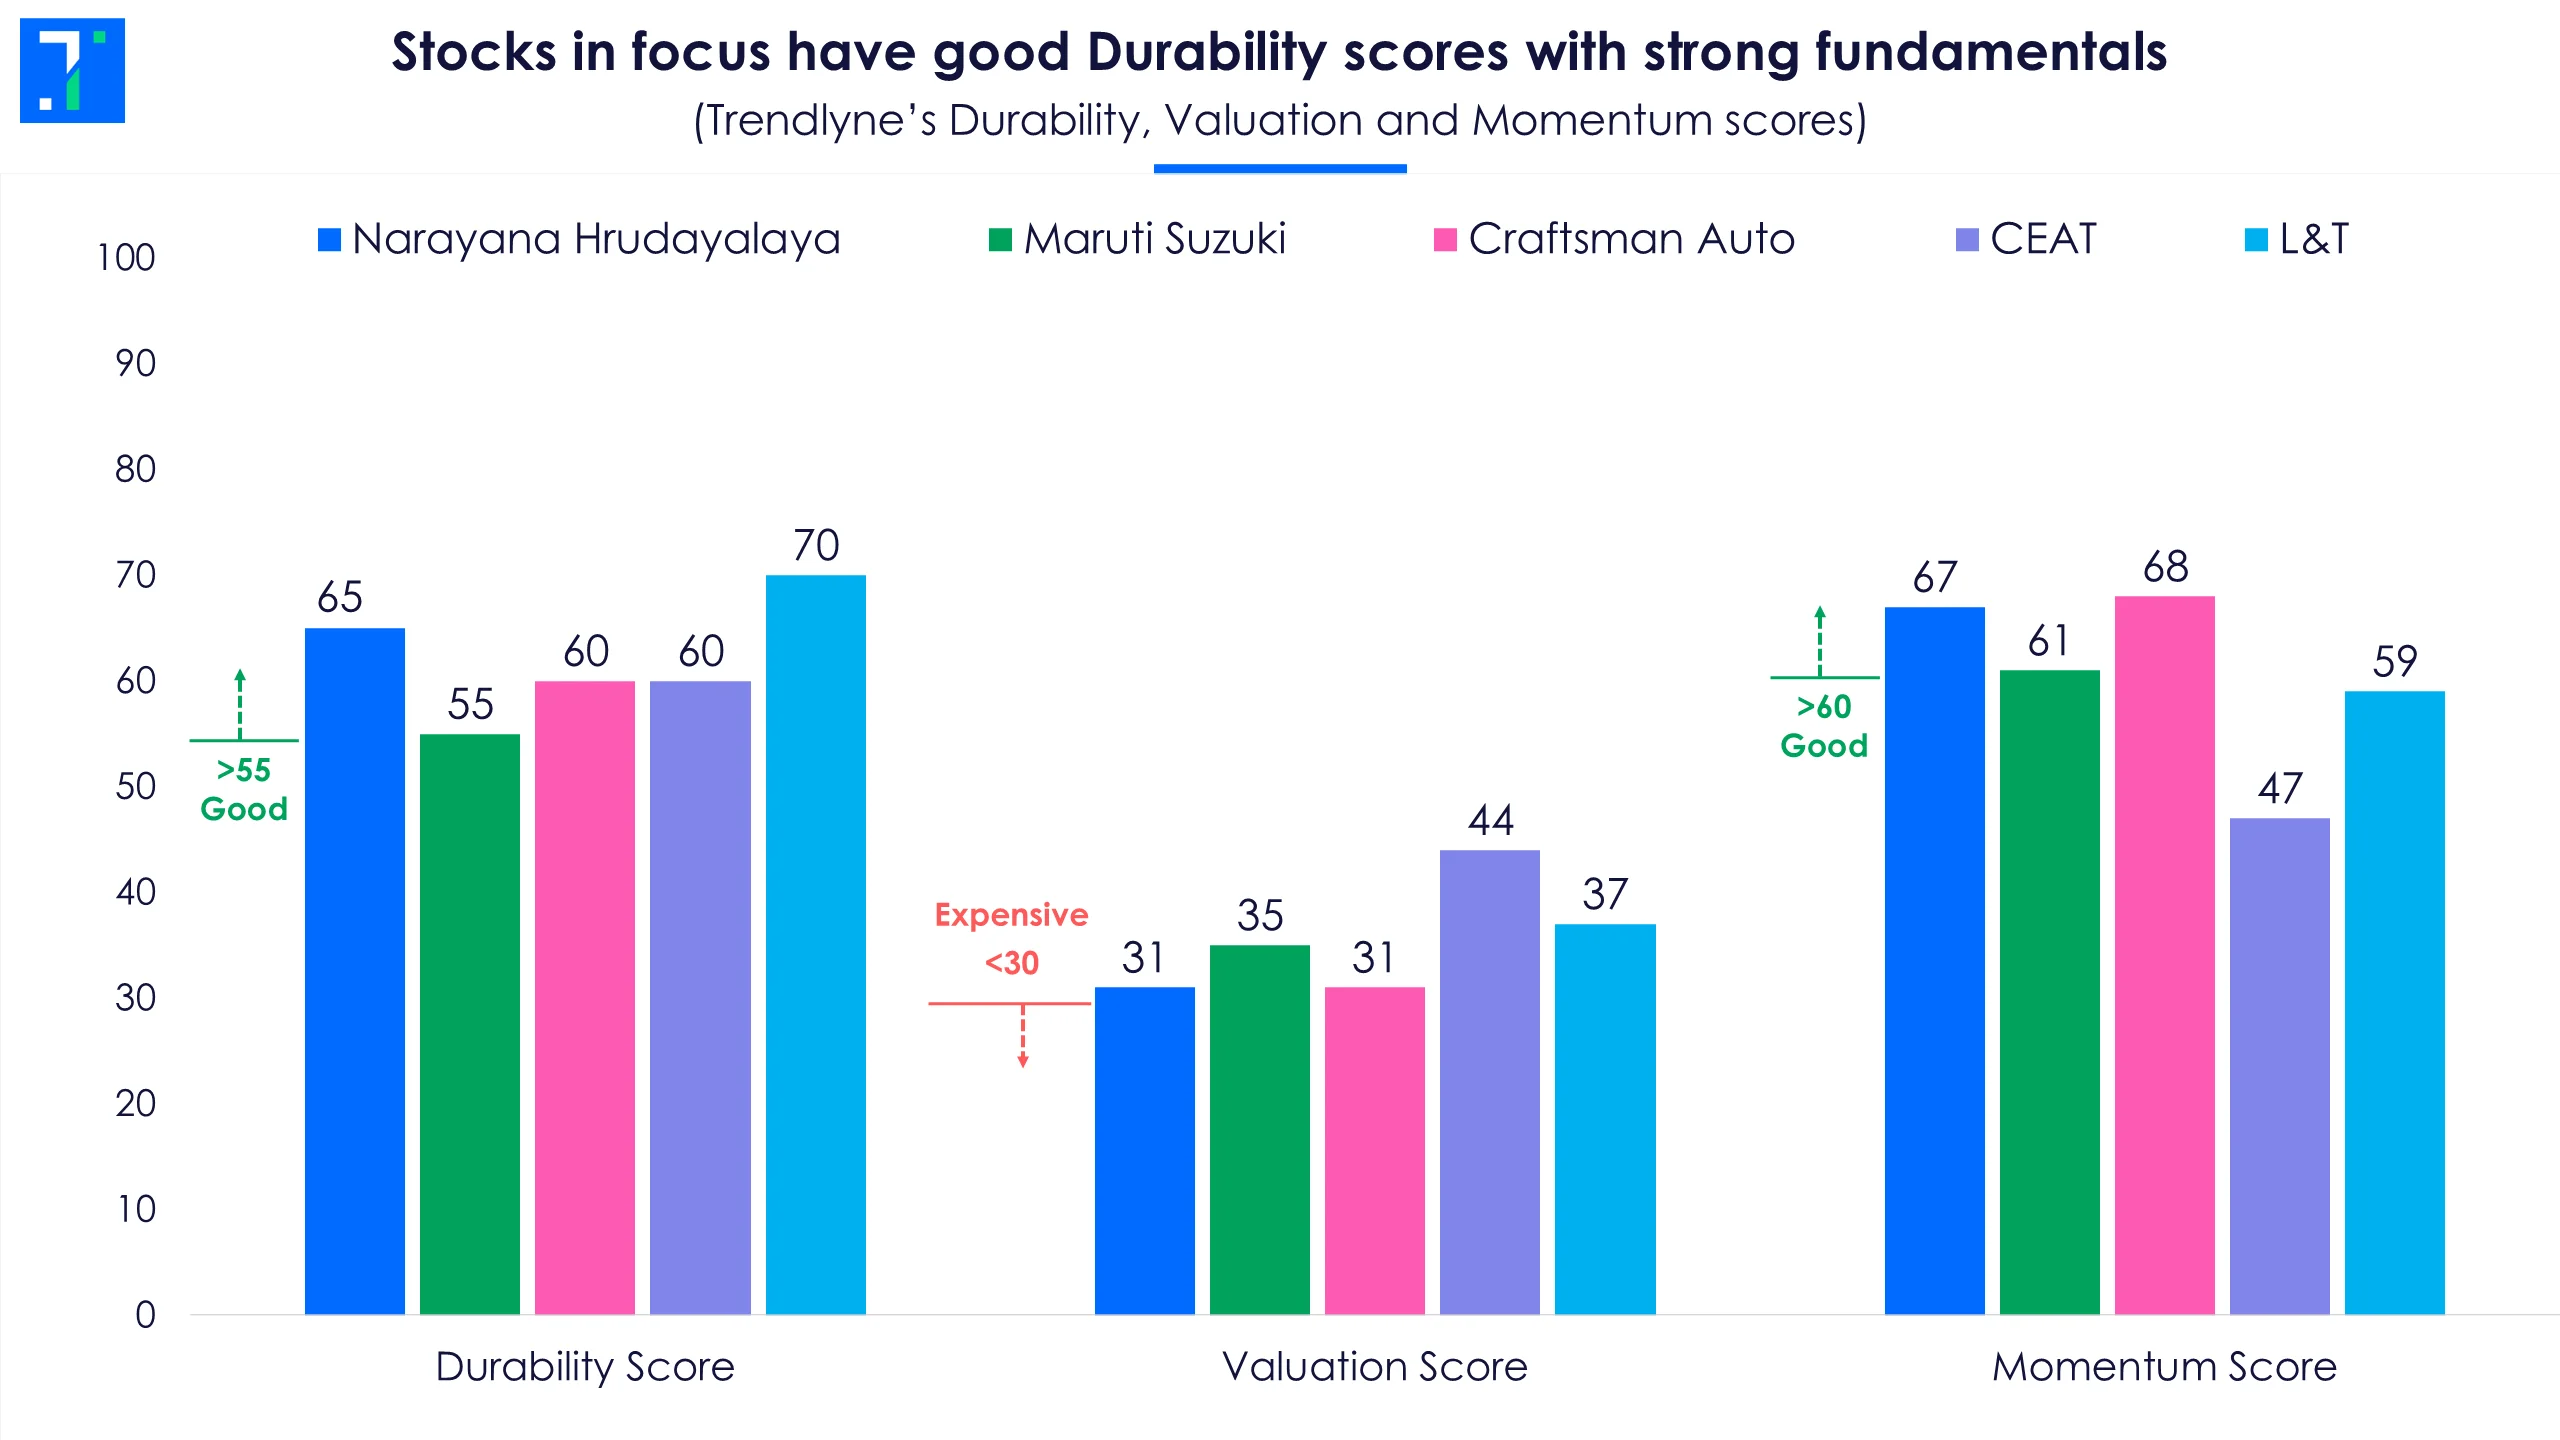
The stocks in focus have either ‘Good’ or ‘Medium’ scores across the Durability, Valuation, and Momentum categories.
Auto demand has been strong, benefiting from GST cuts and a steady stream of new launches. The hospital sector also continues to see healthy traction, with higher occupancies, complex procedures, and new capacity driving growth. Meanwhile, infrastructure companies like L&T are riding the wave of higher government spending on infrastructure projects and the renewable-energy transition.
NH spreads its wings with its UK acquisition
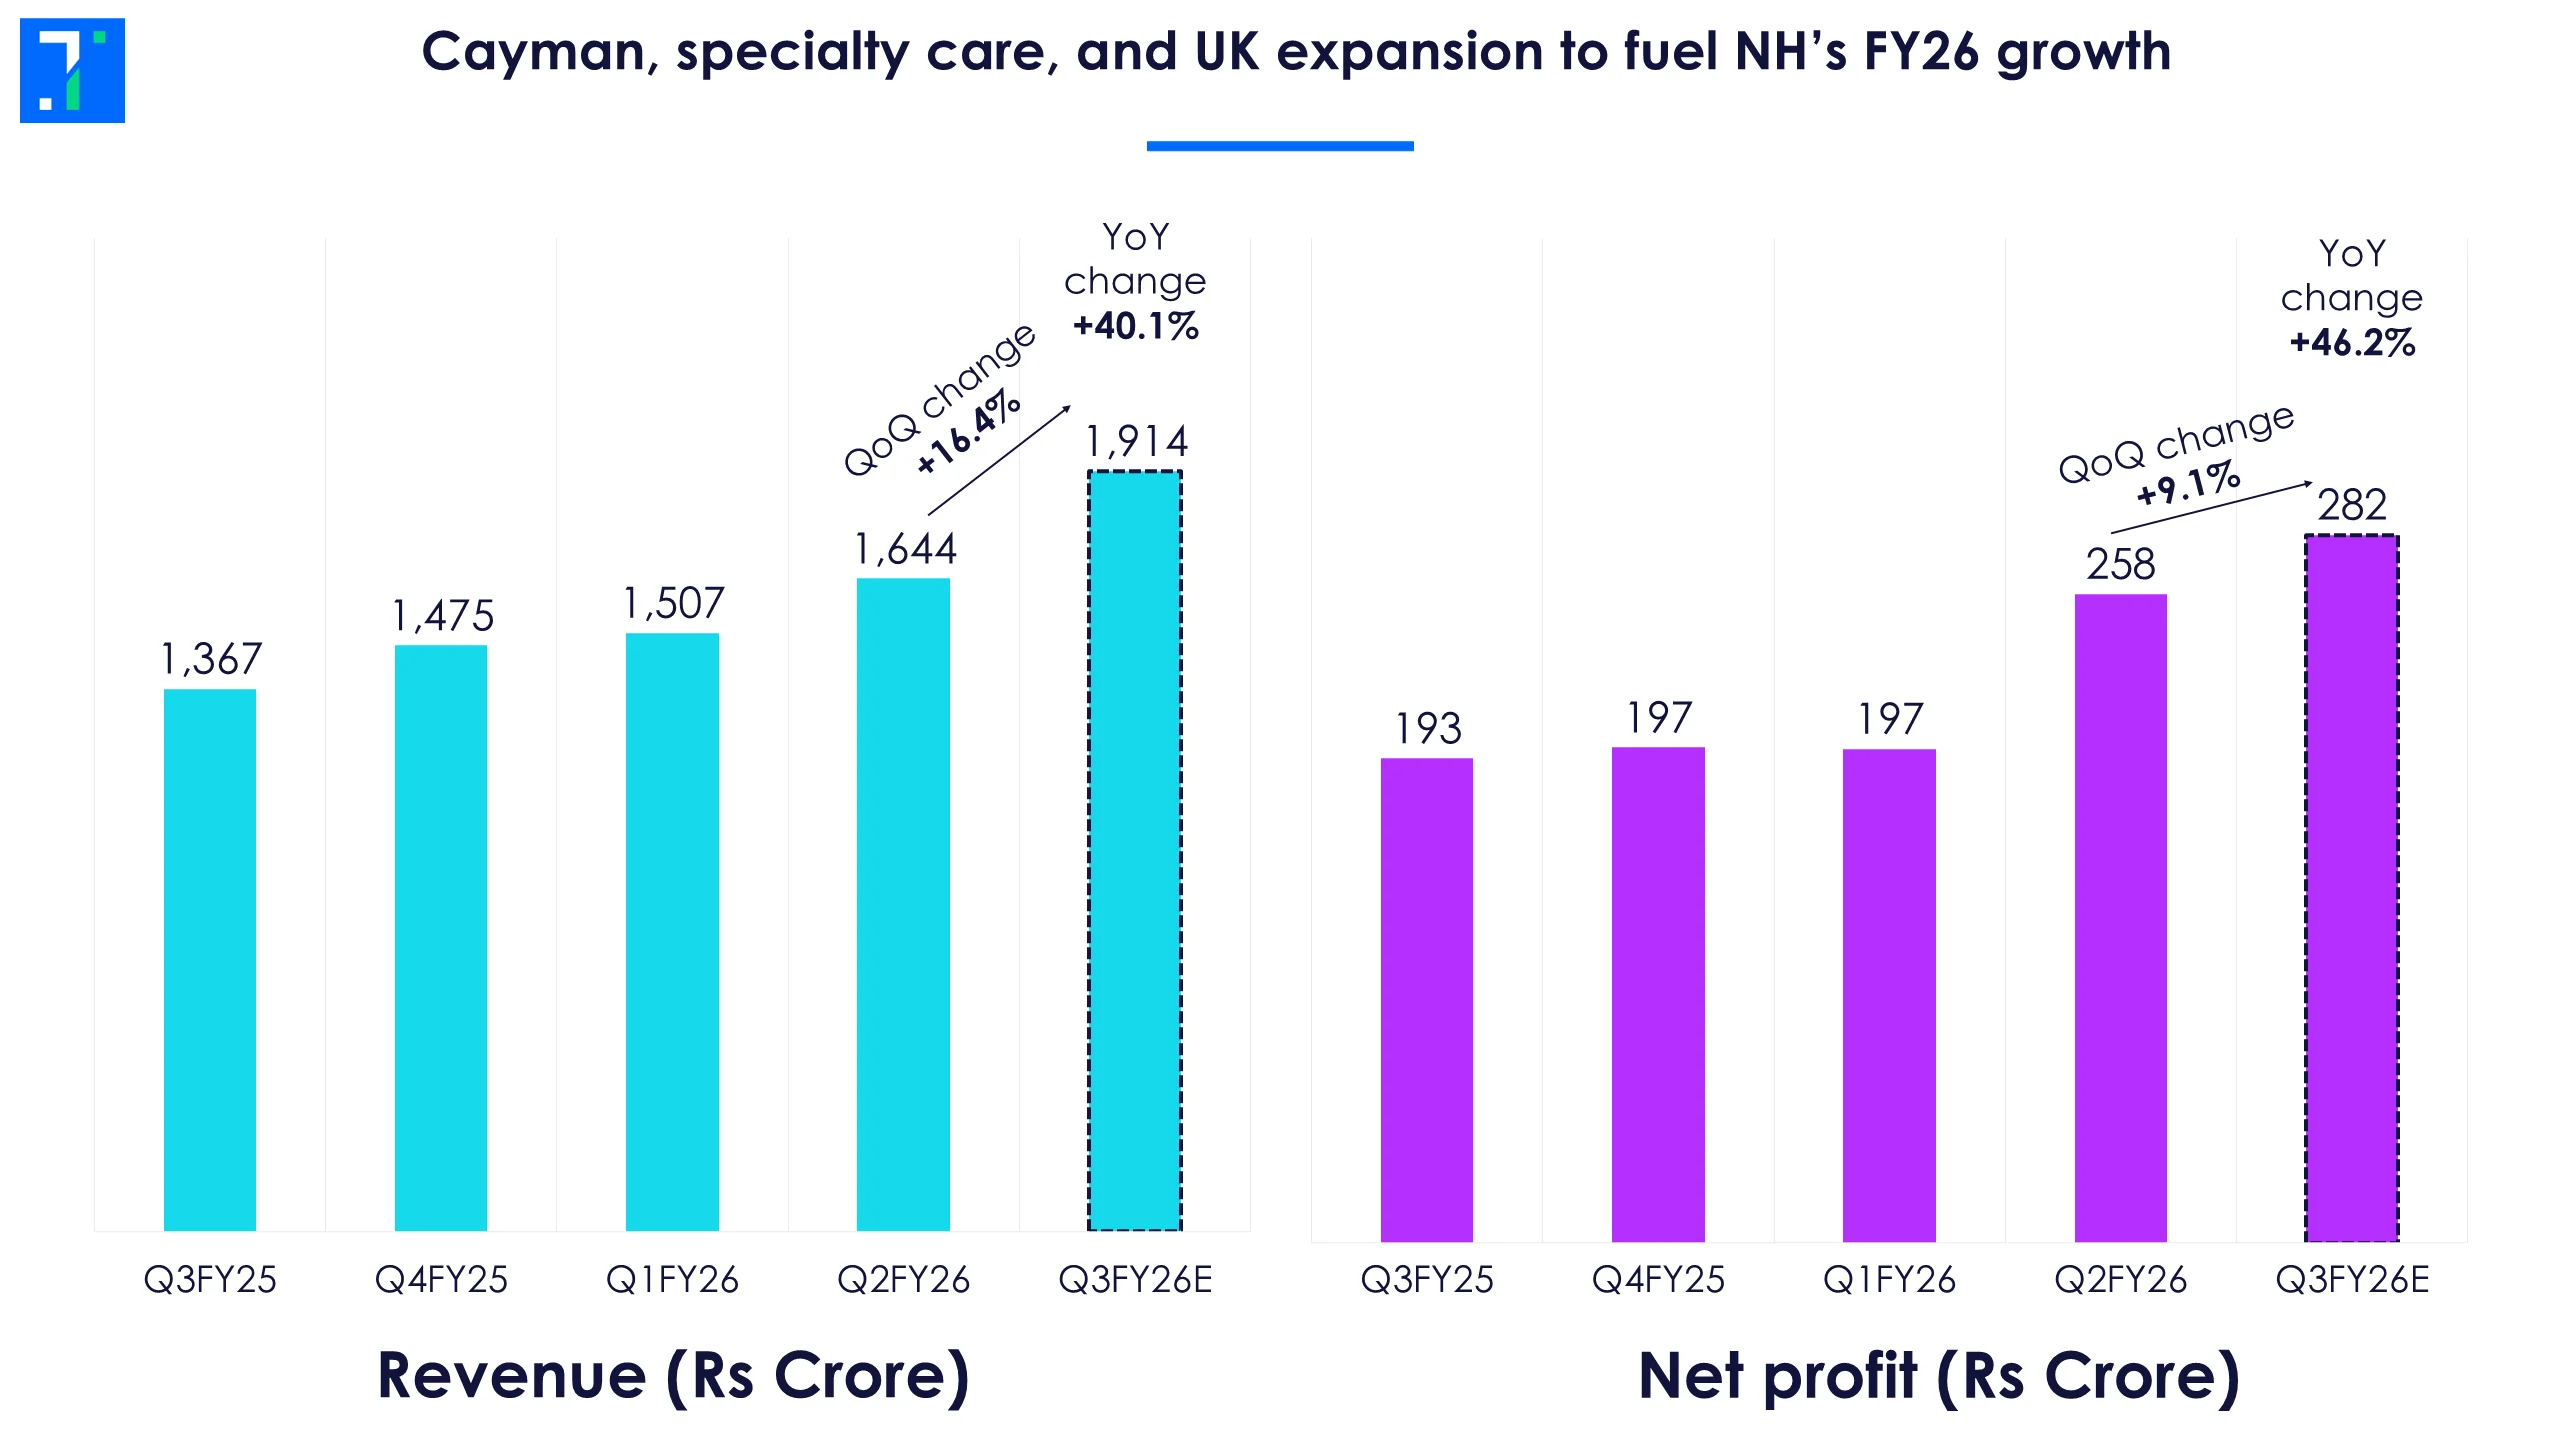
This healthcare provider is seeing impressive growth. High-value cardiac and oncology care, rising per bed revenue and its lean hospital model are set to boost Narayana Hrudayalaya’s Q3 performance.
Domestic hospitals are the main growth engine, with higher surgical throughput and better utilisation lifting margins. The Cayman Islands business is a steady profit maker. But the big milestone is the company’s entry into the UK through the acquisition of Practice Plus Group Hospitals.
Practice Plus gets around 93% of its revenue from UK’s public health system, NHS. NHS faces long waiting times for surgeries and even regular visits. Considering the backlog, Narayana expects its hospitals to benefit from both NHS contracts and private-pay patients.
On the analyst call discussing the UK acquisition, Anesh Shetty, Managing Director at Health City Cayman Islands, said, “Private patients pay more than the NHS, so a good mix between the two would be the ideal outcome for us. Our intention is to increase non-NHS sources, and we expect to make good progress on that.” Management also guided to a medium-term ROCE of 20–22% by FY29–30.
NHS however is a price sensitive market, and risks include domestic pricing regulations, wage inflation, and the challenge of integrating Practice Plus into a labour-tight UK market. Analysts however remain optimistic, citing strong domestic demand and the UK platform as a multi-year growth runway.
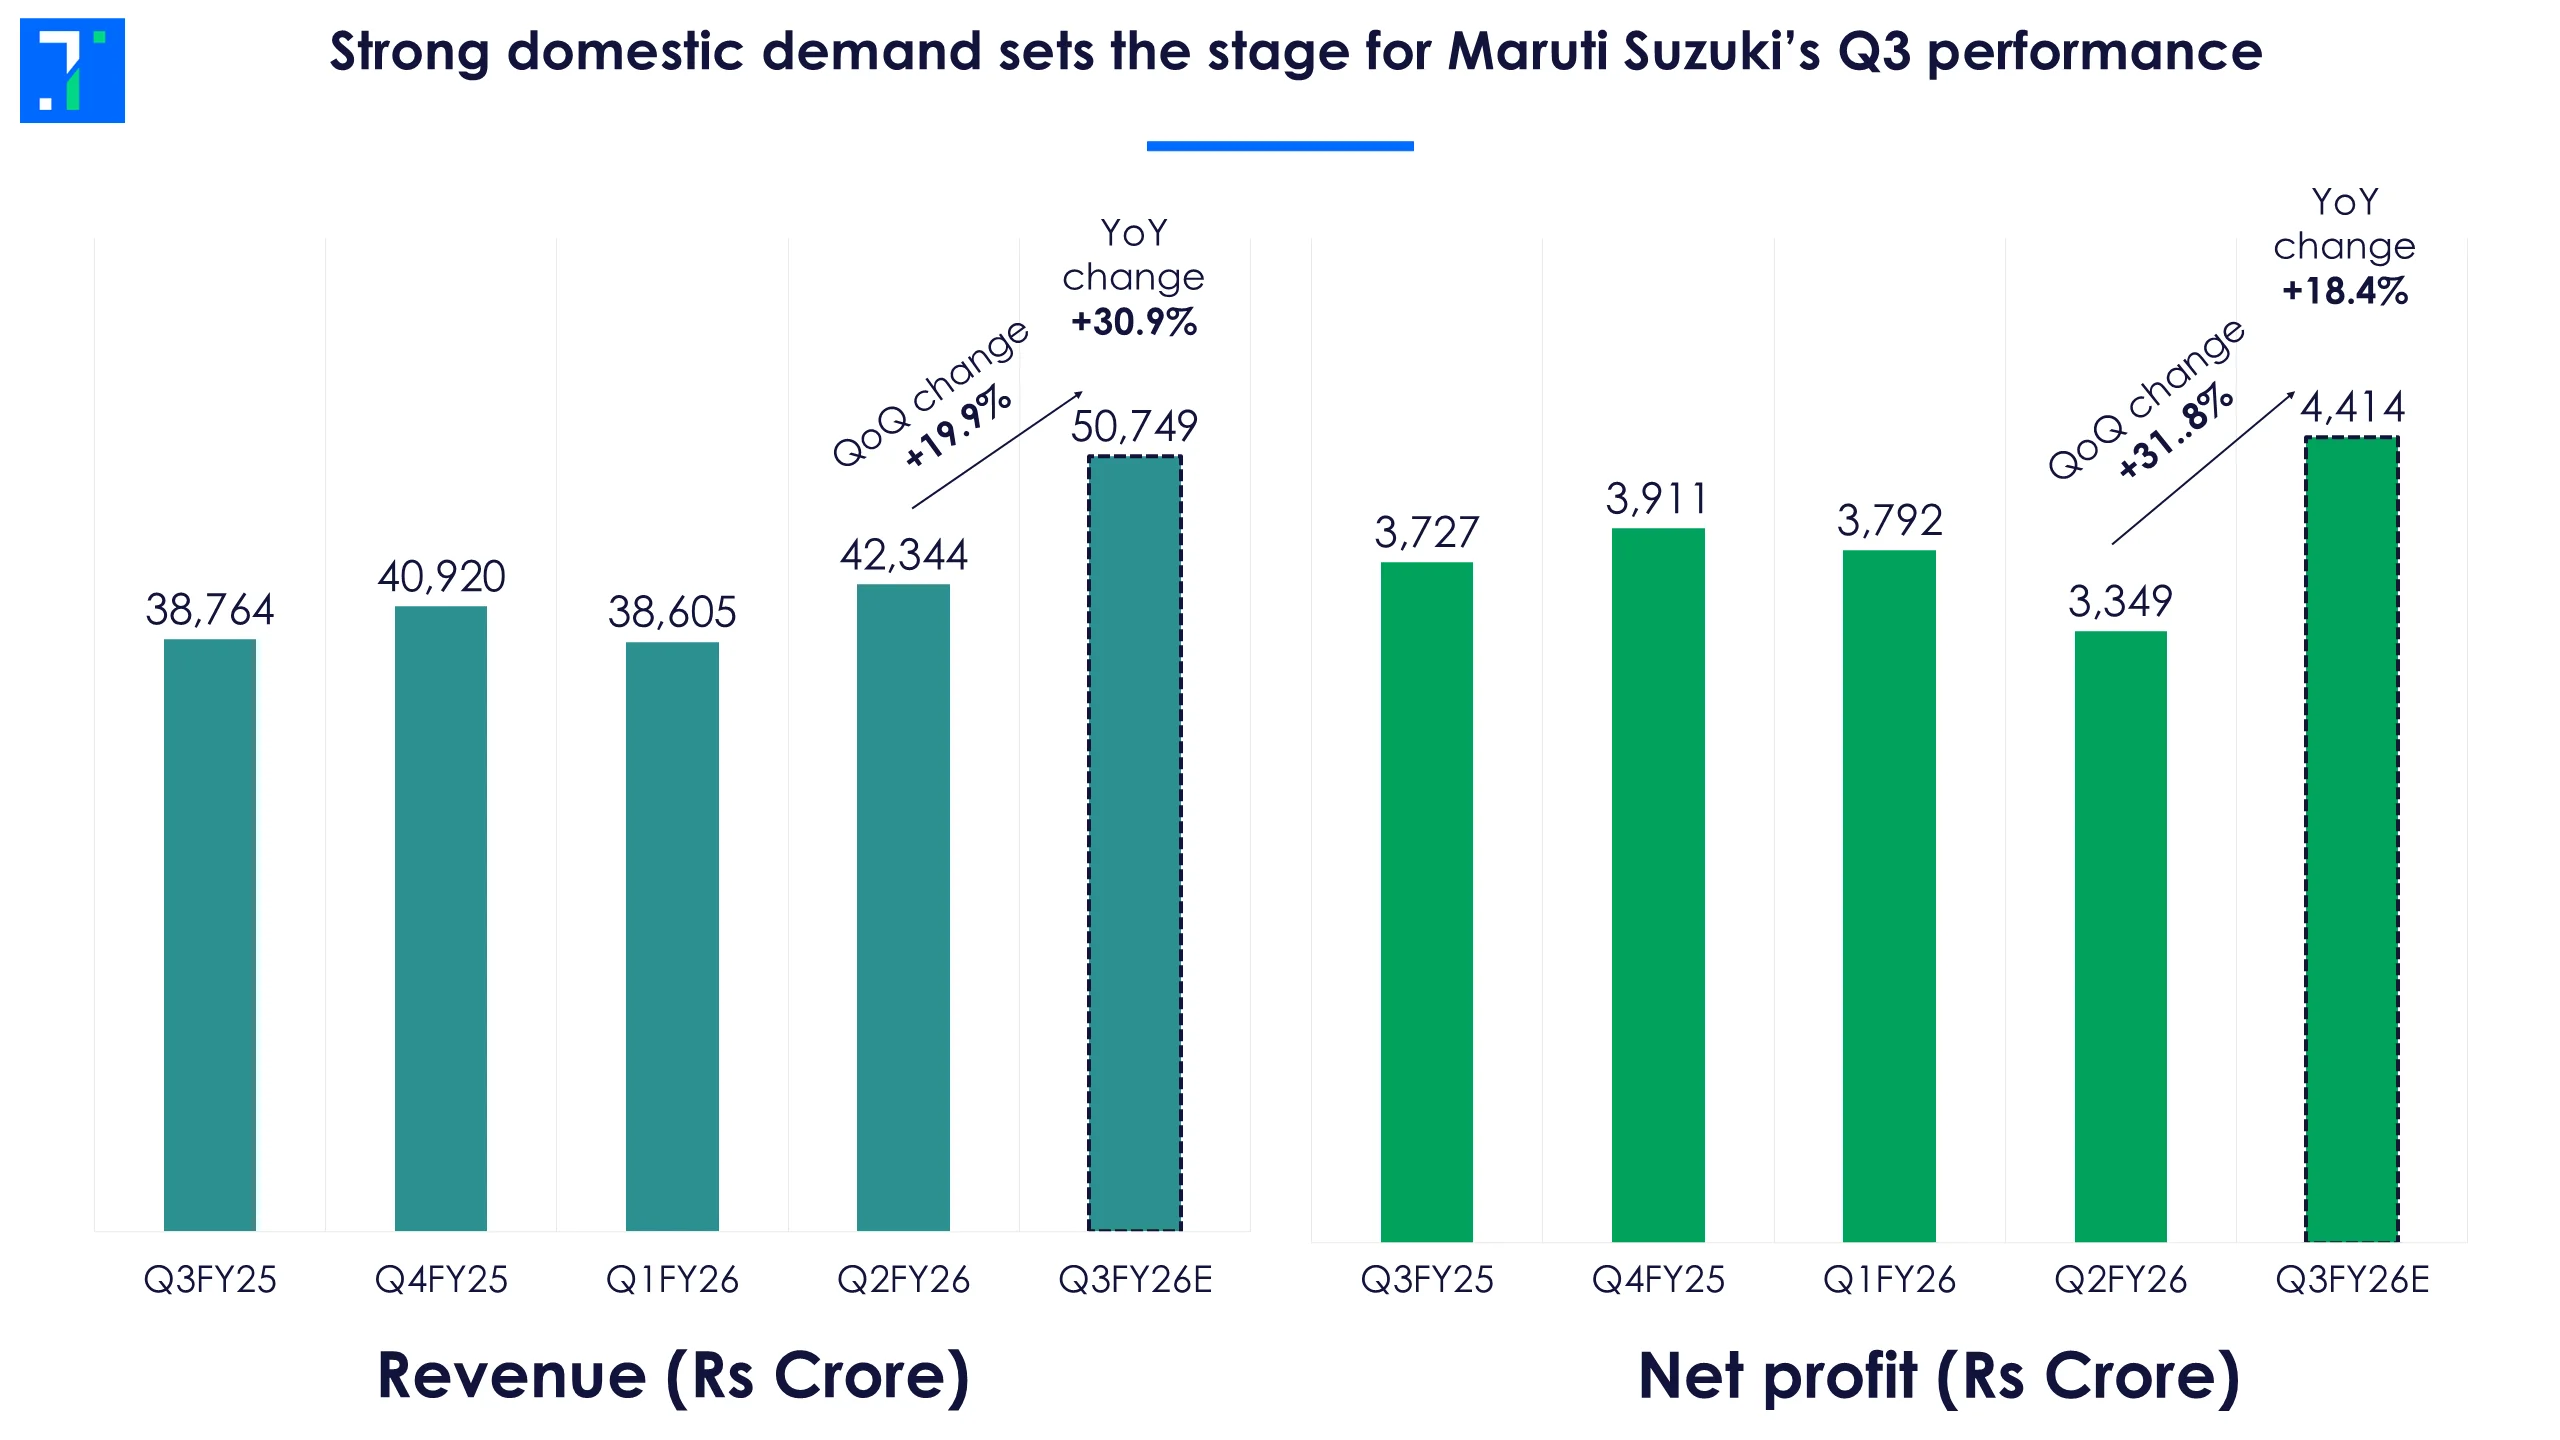
In high gear: Maruti Suzuki sees strong growth in a tough market
Maruti Suzuki is entering 2026 with solid momentum. Passenger vehicle volumes grew 37.3% YoY in December 2025, driven by strong domestic demand.
In an increasingly competitive market, this workhorse brand has used its deep distribution network and wide product reach to hold on to its pole position as India’s largest carmaker.
Indian customers are flocking to SUVs (the bigger and more intimidating the better), and the boom has reshaped the four-wheeler battleground. Tata Motors, Mahindra and Hyundai have scaled up in mid- to premium SUVs and crossovers. This has tightened the battle for market share, even as Maruti dominates in absolute volumes and maintains its strength in hatchbacks and compact cars.
Analysts say that Maruti’s scale, multi-fuel strategy (petrol, CNG and hybrids) and fresh SUV portfolio should continue to drive volumes into FY26. But it needs to keep up with the competition, and the sector’s gradual shift to EVs.
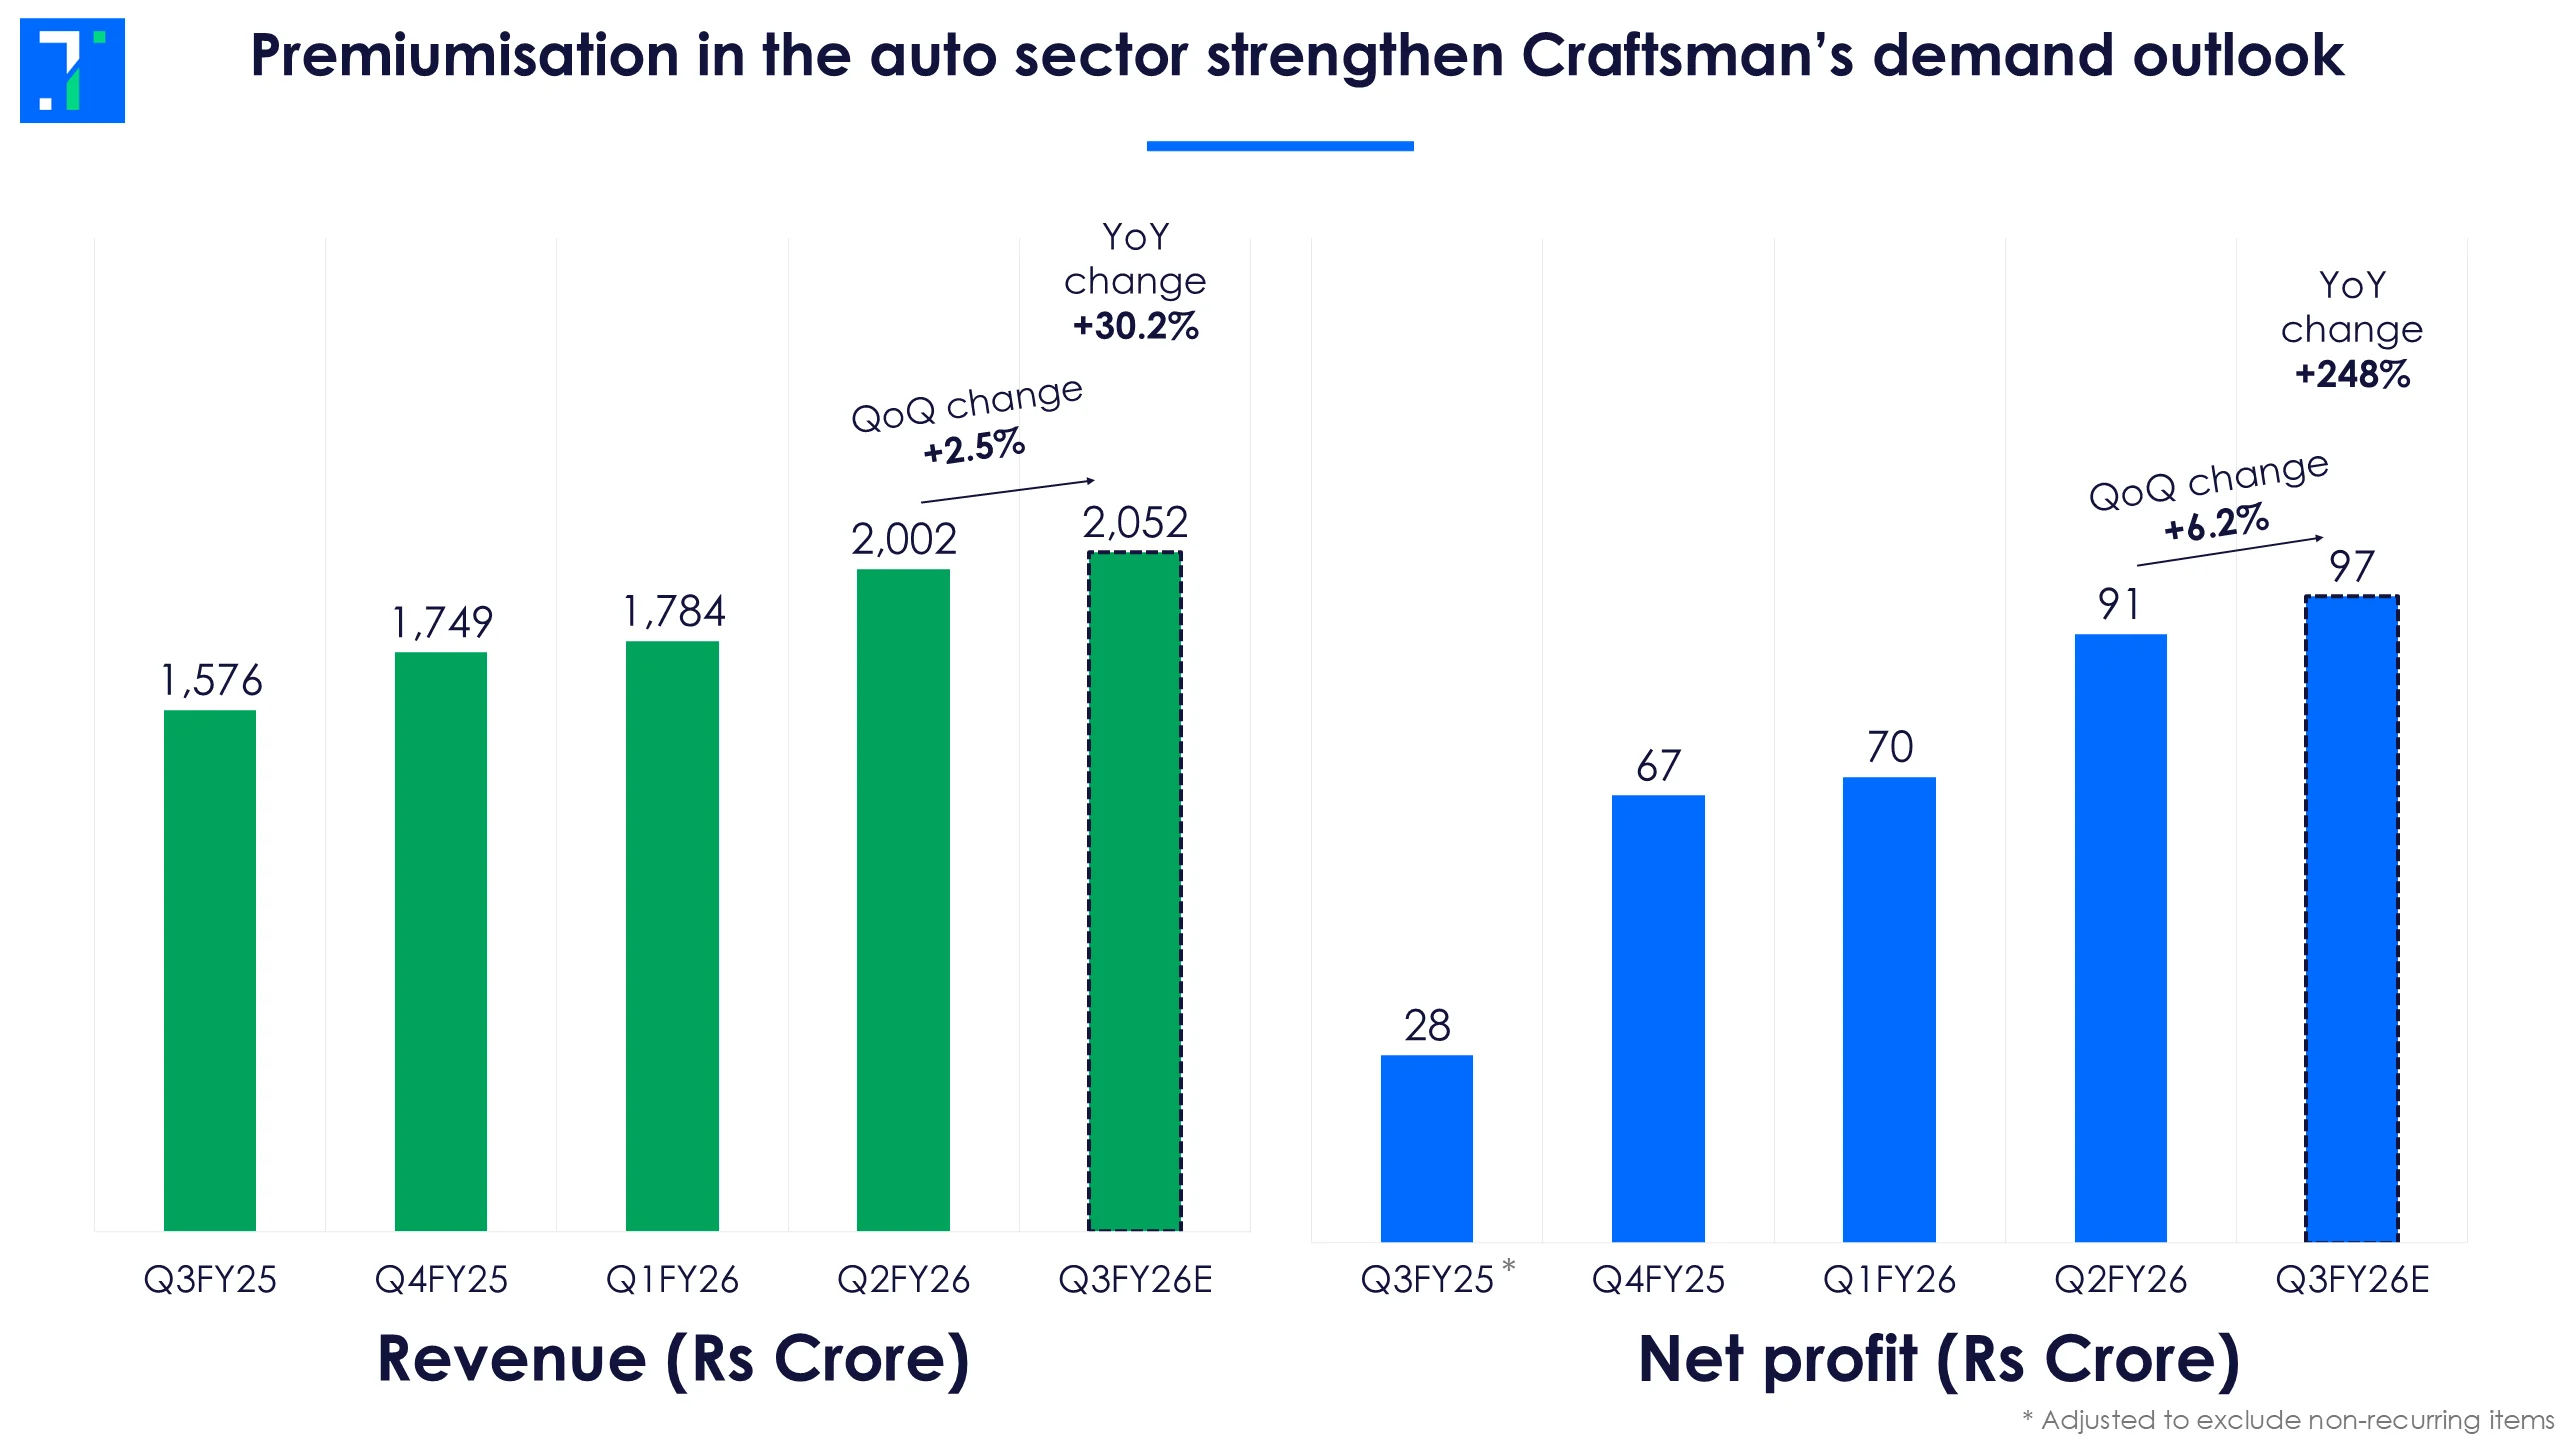
Craftsman Auto is cashing in on the capex boom
Craftsman Automation is a diversified engineering company operating across automotive powertrain components, precision machining, etc. It supplies OEMs for passenger vehicles, tractors, and commercial vehicles.
Premiumisation in the auto sector has taken off, boosting its margins. There is also higher aluminium content per vehicle, and more local buying of precision components. Craftsman’s vertically integrated casting and machining setup differentiates it from competitors who have outsourced these processes, allowing it to respond quickly to these trends while offering better cost and quality control.
Srinivasan Ravi, Chairman & Managing Director of Craftsman Automation, said, “We are seeing large commitments from OEMs for new plants across the country. We are going to see the capacity with our existing customers growing around 50% in the next three years.”
Rubber meets revenue, as CEAT goes premium
This tyre manufacturer is leaning into premium tyres for SUVs, cars and upmarket two-wheelers, where demand and pricing are stronger than in the mass-market. This shift toward higher-value tyres has improved the company’s mix and helped its margins.
On the demand side, replacement tyre sales are steady, while OEM orders have improved alongside domestic auto volumes.
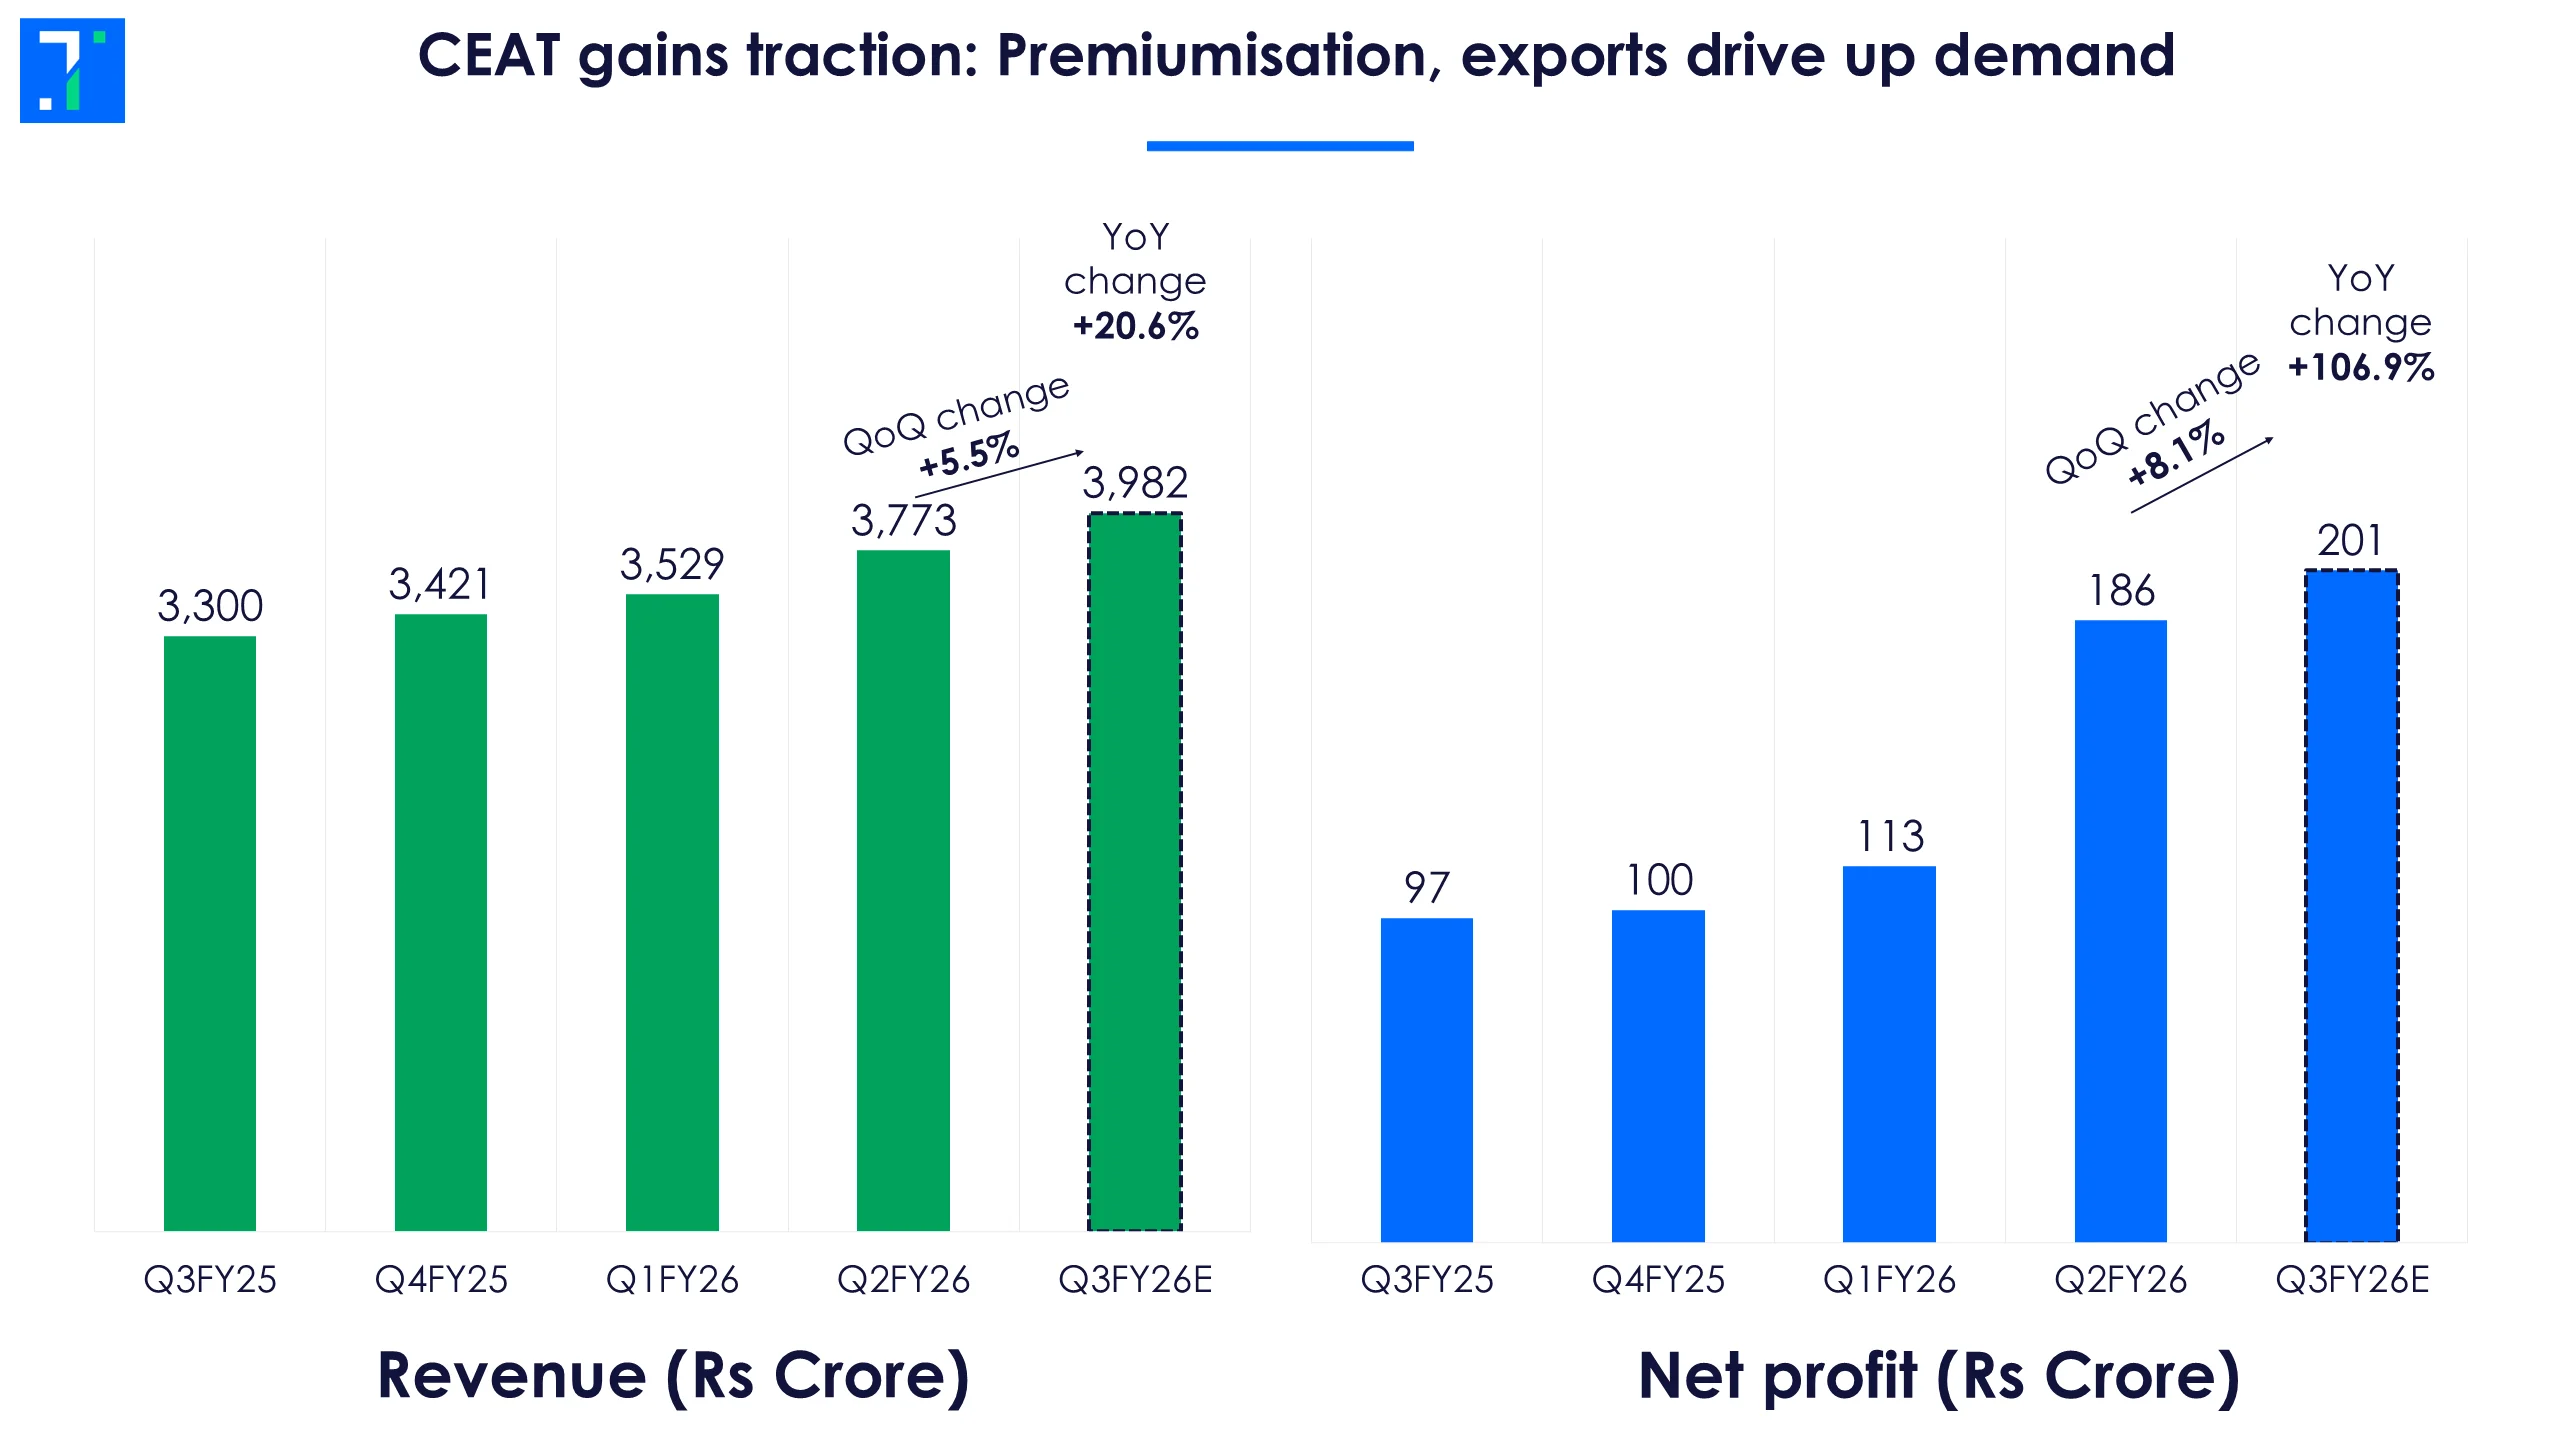
A big tailwind for CEAT has been lower input costs for rubber and crude-derived materials. This has boosted profitability, though management and analysts have both warned that input price softness is cyclical and could worsen as commodity markets turn.
The competitive backdrop is also evolving, with other tyre-makers also focusing more on premium tyres. Risks for CEAT include raw material volatility, pricing pressure from OEMs and higher freight costs for export markets. CEAT derives around 20% of its revenue from exports.
L&T cements its growth story with infra capex and global orders
Larsen & Toubro (L&T), India's engineering and infrastructure giant, reported strong revenue growth in Q2, with sectors like Hydrocarbon, Precision Engineering, and Heavy Engineering growing fast. International revenues now account for a significant share of the total.
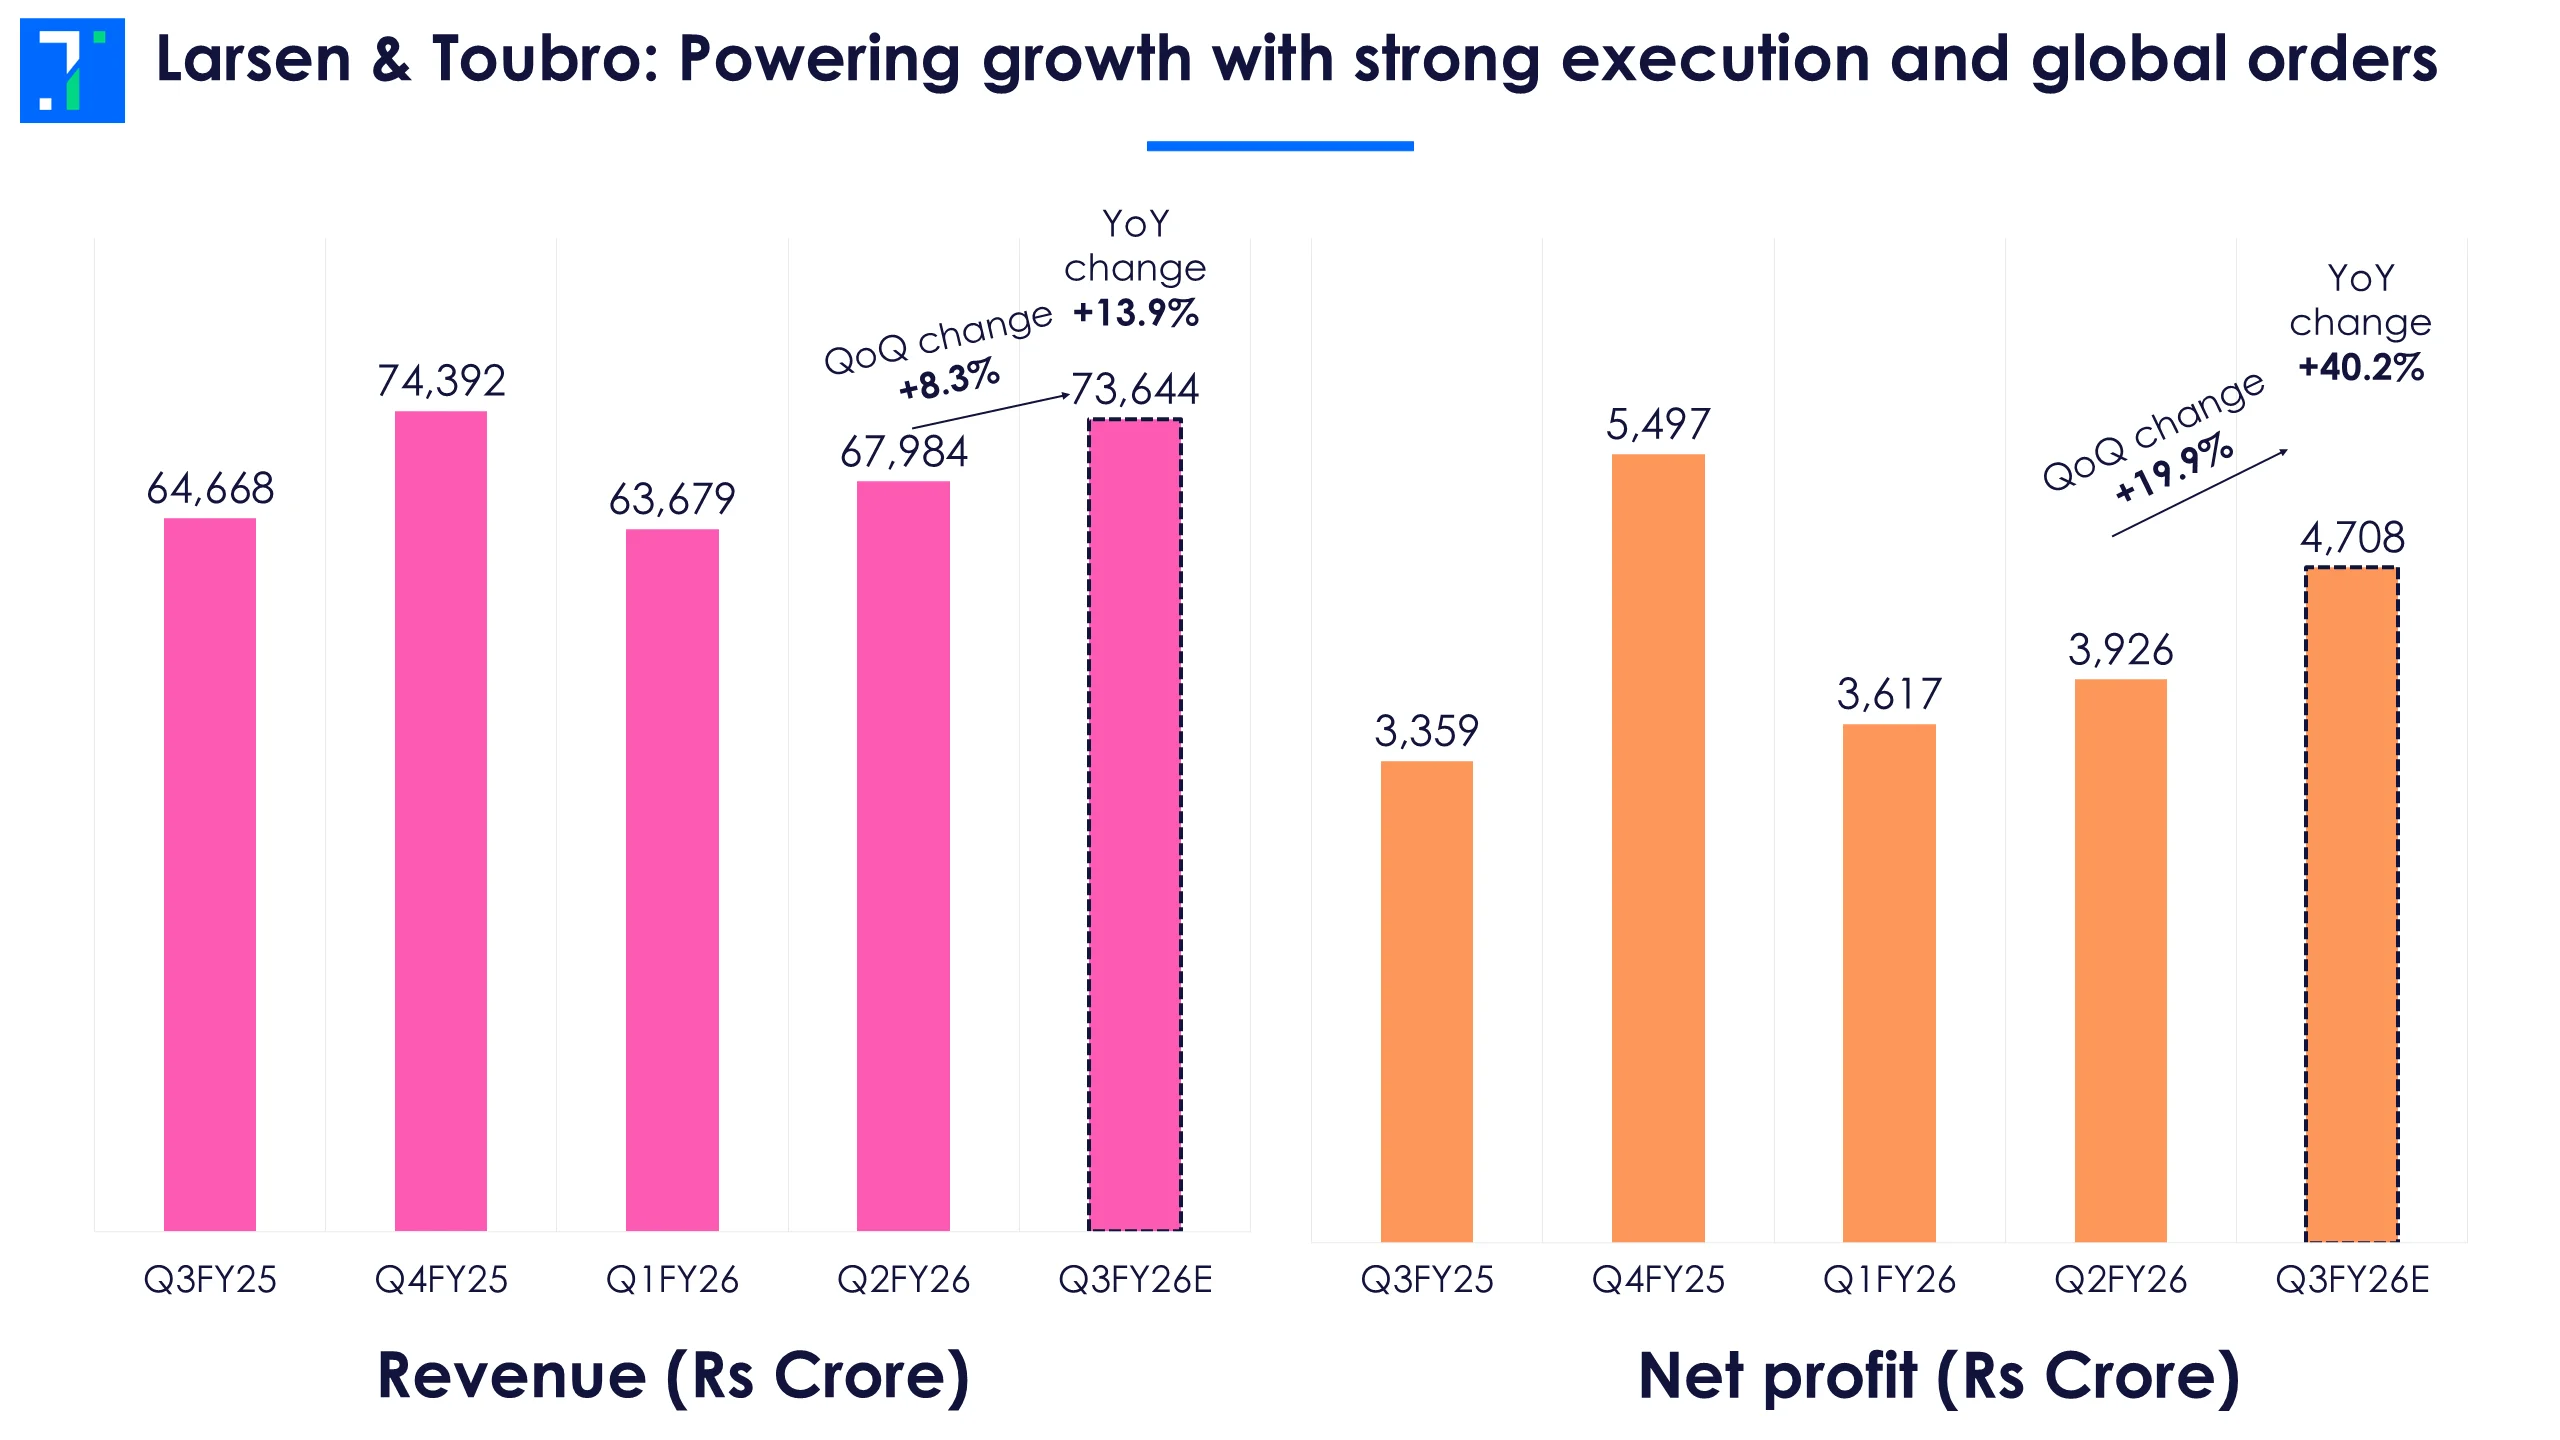
A key differentiator for L&T is its ability to execute complex, large-ticket contracts across geographies. The company has been more aggressive than its peers in bidding for offshore energy, industrial, and precision engineering projects, positioning itself alongside global EPC players rather than purely domestic contractors.
Management commentary has highlighted healthy order inflows and sustained bid activity in the Middle East and Southeast Asia. The company continues to guide for steady growth in Q3 and into FY26, backed by a highly visible order book and better execution efficiency.
Follow the latest Q3 results live here.
Picture of the week
We are starting a new section in the newsletter, which is an interesting image we came across during the week.

This week's photo is of a coffin in Ghana, photographed during the funeral.
The people of Ghana say that one must "celebrate death as we celebrate life". Their funerals are colorful, loud affairs, and include coffins shaped like pineapples, teapots, and Coca Cola bottles.
