My Newsfeed

logo
The Baseline
10 Mar 2023, 05:15PM
Five Interesting Stocks Today
  1. Hindustan Aeronautics: This defence stock rose over 5% in trade on Wednesday and touched its 52-week high after bagging a contract from the Ministry of Defence. The contract worth Rs 6,800 crore is for the supply of 70 HTT-40 trainer aircraft to the Indian Air Force.

The new aircraft are meant to boost the training program for air force pilots. This aircraft has been on the list of weapons and systems that India imposed an import ban on for the past 30 months. Hindustan Aeronautics will supply these planes to the IAF over a period of six years.

HAL has risen around 15% in the past month and over 112% in the past year. As a result, the company makes it to a screener of stocks with strong momentum. Defence stocks in general, have been on the rise for the past two years due to the Centre’s focus on reducing import of defence equipment and promoting domestic manufacture. The defence industry has risen close to 78% in the past year.

Post this order win, ICICI Direct initiated coverage on the stock with a ‘Buy’ rating and a target price of Rs 3,240, implying an upside of 14%. The brokerage says that HAL has a healthy order book of Rs 84,000 crore on the back of large-scale orders in the manufacturing segment and engines. It expects HAL to achieve revenue and EBITDA CAGR of 10.3% and 14.8% respectively over FY22-25E. While the company has a huge order book, timely order execution will be key going forward.

  1. JSW Energy: This electric utilities stock has had a difficult six months as it fell 23.3% over the period. But it showed a resurgence in the past month and rose 20.45%. The growth came after the company’s Joint Managing Director and Chief Executive Officer (CEO) Prashant Jain spoke about a rise in demand in February and revealed its plans to expand energy generation capacity. This helped the company show up in a screener of stocks which gained more than 20% in the past month.

The stock has been on a rally since Jain said that the company expects energy demand to improve in the summer owing to the El Nino effect, and an impending heat-wave in India from March to May. It rose 12.7% on February 28 and 11.2% over the past week.

According to Prashant Jain, the company witnessed a 7.5%-8%  increase in power demand in February, owing to growth in economic activities like industrial production and manufacturing. He also mentioned the company’s plans to expand its total energy generation capacity to 10 GW by 2025 and 20 GW by 2030, while also planning to generate 80% of the energy capacity through renewable sources by 2030.

  1. G R Infraprojects: After declining more than 17% from February 14 till March 6 and touching its 52-week low on February 28, this roads & highways construction company shows signs of regaining lost ground. The stock has risen 6.5% since March 6, trading at high volumes on Thursday. This upward price momentum came after the firm announced that it received a completion certificate for the construction of an eight-lane expressway for Rs 1,047 crore in Madhya Pradesh. The company also bagged a contract worth Rs 1,248.4 crore for the construction of a six-lane highway in Bihar. It shows up in a screener for stocks in the PE and P/BV buy zone.

The company’s order book as of Q3FY23 stands at Rs 14,073 crore, of which 87% is hybrid annuity mode (HAM) projects and 6% is engineering, procurement & construction projects. The company is also trying to expand into the transmission and railway segments, which currently account for 2% and 4% of the order book respectively.

The management maintains its order inflow guidance at Rs 15,000 crore for FY23 on the back of a strong order pipeline in the roads segment and opportunities in the railways, transmission and ropeways sectors.

  1. Mahanagar Gas (MGL): This city distribution gas stock rose 8.7% in trade on Monday after it announced plans to acquire a 100% stake in Unison Enviro for Rs 531 crore. Ashoka Buildcon and North Haven are the existing shareholders of Unison Enviro and will transfer their shares to MGL once the Petroleum and Natural Gas Regulatory Board waves a green flag. The stock has risen 10% in the past week, touching a new 52-week high on Thursday. Over the past year, the stock went up 31%.

The acquisition will expand MGL’s distribution network in Ratnagiri, Latur and Osmanabad areas of Maharashtra. It will also help expand its presence in Chitradurga and Davanagere in Karnataka. Reports suggest that volumes may increase to 1 mmscmd (million metric standard cubic meters per day) from current volume of 0.1 mmscmd, by FY28, with an investment of Rs 700-800 crore in Unison Enviro. Another benefit for MGL is Raigad’s (a coastal district in Maharashtra) proximity to Ratnagiri, where it has distribution rights. This would give the company an opportunity to expand beyond the Mumbai Metropolitan area.

MGL has posted robust Q3FY23 results with net profit growth of 3X YoY to Rs 172.1 crore. It beat Trendlyne’s Forecaster estimates by 4.4%. With this acquisition, ICICI Securities reiterates its ‘Buy’ rating on the stock but with a revised target price of Rs 1,125, which is 7% over the previous target price of Rs 1,050. It expects EBITDA to grow to Rs 2,100 crore by FY28E.

According to the brokerage, the acquisition looks meaningful in the medium- and long- term. However, its inability to pass on high gas costs and delayed execution of expansion plans are risks to watch out for. 

  1. Bharat Forge Ltd: Thisindustrial products firm has opened an e-bike manufacturing facility with a production capacity of 60,000 units per annum. The facility will handle the assembling of e-bikes for Tork Motors. The promoter group firm, Kalyani Powertrain, owns a 64.3% stake in Tork Motors. Tork Motors is FAME-II approved and has orders for electric commercial vehicle components. The stock remainedflat post the inauguration of the new facility.

Kalyani Strategic Systems Ltd (KSSL), a wholly owned subsidiary of Bharat Forge, won an order worth Rs 600 crore in Q3. The order book for defence exports stands at Rs 2,000 crore. Bharat Forge is also expecting orders for Advanced Towed Artillery Guns (ATAG) in the coming quarters. This gives execution visibility of 2-3 years for KSSL. The industrial segment of Bharat Forge has also won orders for Rs 265 crore, taking the total order book size to Rs 1,500 crore

The company sees increased demand in aerospace component manufacturing. Currently, aerospace contributes less than 10% of revenue. Bharat Forge is the only firm with prerequisite capabilities to build aerospace components in India.

Bharat Forge has completed the acquisition of JS Autocast for Rs 490 crore, adding roughly Rs 450 crore to its revenue. It has also completed the Sanghvi Systems takeover. The two new acquisitions will grow at a CAGR of 35% for the next two years. The stock shows up in a screener with improving cash flows and good durability.

Trendlyne's analysts identify stocks that are seeing interesting price movements, analyst calls, or new developments. These are not buy recommendations.

logo
The Baseline
10 Feb 2023, 05:10PM
Which stocks did superstar investors buy in Q3FY23?
By Abhiraj Panchal

Many investors closely track the portfolios of superstars to identify interesting sectors and stocks to invest in. We take a look at some of the stocks superstar investors bought or added more of, during Q3FY23.

Most superstar investors didn’t see major QoQ changes in their net worth in Q3FY23, except Dolly Khanna. Her net worth fell by 21.4% QoQ to Rs 409.74 crore during the quarter. 

Sunil Singhania and Vijay Kedia’s net worth fell by 5.1% and 5.3% respectively, while Porinju Veliyath’s net worth fell by 1.3%. Ashish Kacholia’s net worth rose by 1.6% and Rakesh Jhunjhunwala's portfolio value rose marginally.

These superstars have varied investing interests, as shown in the chart below, which indicates the sector with the biggest share in each superstar’s portfolio. 

RARE Enterprises’ favoured sector is textiles, apparels and accessories, while Sunil Singhania’s is metals and mining, Ashish Kacholia’s is chemicals and petrochemicals.

Rare Enterprises increases stake in Banking & Finance and Auto stocks

Rakesh Jhunjhunwala’s portfolio rose marginally by 0.01% QoQ to Rs 33,230.4 crore in Q3FY23. Rare Enterprises, which manages the late big bull’s portfolio, increased stakes in several companies during the quarter. 

Rakesh Jhunjhunwala’s portfolio increased its stakes in Rallis India and Federal Bank by 0.9% each to 10.3% and 3.5% respectively. It also increased its holding in Geojit Financial Services and Canara Bank by 0.8% and 0.6% to 8.4% and 2.1% respectively.

Rare also increased holdings in Tata Motors and NCC by 0.5% each during Q3, and bought more shares in Karur Vysya Bank, Tata Communications and Edelweiss Financial Services

According to shareholder filings, the portfolio’s largest buys were healthcare supplies company Bilcare and auto parts and equipment maker Autoline Industries. But this data point should come with a disclaimer. 

In Q1FY23, the total holding of Rakesh and Rekha Jhunjhunwala in Bilcare and Autoline was 8.5% and 4.5%, respectively. In the Q2FY23 BSE fillings of Bilcare and Autoline Industries however, the names of Rakesh Jhunjhunwala or Rekha Jhunjhunwala are not mentioned in the shareholders list. But the Q3FY23 BSE filings of both the companies show Rekha Jhunjhunwala back in the list as a shareholder with significant stakes. She holds a stake of 7.4% in Bilcare and 4.3% in Autoline Industries. 

The large movement in shareholding could be due to a filing error in Q2, and hence these companies are not included in the chart above. 

Sunil Singhania’s Abakkus Fund increases stake in multiple small-cap companies

Sunil Singhania’s Abakkus Fund saw its consolidated net worth fall by 5.1% QoQ in Q3FY23 to Rs 1,973.8 crore. It added Tracxn Technologies to the portfolio during the quarter by buying a 1.6% stake in the IT consulting company. It also bought a 1.8% stake in Dreamfolks Services, a travel support services company and added a 0.3% stake in Mastek, increasing its stake in the IT company to 3.1%. 

The fund also bought an additional 0.2% stake in Sarda Energy & Minerals, Ion Exchange (India) and Technocraft Industries (India) each, bringing its stake to 2.1%, 3.2% and 3% respectively. It added minor stakes in already existing small-cap portfolio companies like Dynamatic Technologies, Stylam Industries, Siyaram Silk Mills and HG Infra Engineering, taking its holdings to 2.6%, 2.4%, 2.1%, and 1.5% respectively. 

After selling its stake in CMS Info Systems in Q2FY23 to below 1%, Abakkus  now holds a 1% stake in the company.

Ashish Kacholia adds four small-cap companies to his portfolio

Ashish Kacholia’s net worth increased by 1.6% QoQ to Rs 1,800.3 crore in Q3FY23. During the quarter, he added Goldiam International (textile company), Raghav Productivity Enhancers (capital goods company), Likhitha Infrastructure (infrastructure service provider) and Knowledge Marine & Engineering Works (transportation company) to his portfolio. He purchased 1%, 2.1%, 2% and 2.3% stakes in these companies respectively.

The marquee investor purchased 1.3% and 1.2% stakes in chemical companies Agarwal Industrial Corp and Yasho Industries respectively and now holds 3.8% in each. During Q3FY23, he added 0.8% of Best Agrolife (now holds 2.3%), 0.6% of SJS Enterprises (now holds 4.4%), 0.4% of TARC (now holds 2.2%) and 0.2% of Ador Welding (now holds 4.4%) to his portfolio. 

Kacholia bought an additional 0.1% stake in Gravita India, Megastar Foods and Xpro India, and now holds 2.1%, 1.1% and 4.5% stakes respectively. The other companies where he increased stakes were Garware Hi-Tech Films and PCBL.

Dolly Khanna makes no new additions to her portfolio in Q3FY23

Dolly Khanna’s net worth fell by 21.4% QoQ to Rs 409.7 crore in Q3FY23. Compared to previous quarters, the investor drastically slowed down buying in Q3. She only increased her stake marginally in three companies and did not make any new additions to her portfolio. Khanna tends to turn bearish when markets become volatile, so this is not unusual for the investor.. 

She raised her stake in Industrial Gases company National Oxygen by 0.1% to 1.2%. The company has risen over 6.3% over the past three months till February 8. She also raised 0.05% stake each in Monte Carlo Fashions and Prakash Pipes.   

Porinju Veliyath makes three new additions to his portfolio in Q3FY23

Porinju V Veliyath’s net worth fell by 1.3% QoQ to Rs 174.9 crore in Q3FY23. He added three new small and micro-cap companies to his portfolio. He bought a 1.3% stake in furniture manufacturer Priti International and 1.1% stake each in Max India and Lakshmi Automatic Loom Works in Q3.

The investor raised his stake in Special Consumer Services company Kaya by 1% to 2.4% in Q3FY23. This is after he cut 0.1% from  the company holding in Q2FY23. He also bought an additional minor stake in Aurum Proptech.

Vijay Kedia adds Siyaram Silk Mills to the portfolio

Vijay Kedia’s net worth fell 5.3% QoQ to Rs 729.7 crore in Q3. Kedia’s only buy during the quarter was a new addition–a 1.1% stake in Siyaram Silk Mills, an Indian blended fabric and garment manufacturer. In Q3FY23, the textile company’s net profit fell for the first time in the past seven quarters to Rs 51.9 crore.

Mohnish Pabrai increases his stake in Edelweiss Financial Services

Mohnish Pabrai’s net worth in Q3FY23 fell by 6.9% QoQ to Rs 1,540.02 crore. The only change he made in his portfolio was buying an additional 0.3% stake in Edelweiss Financial Services. As of Q3FY23, he holds a 6.7% stake in the company. The financial services company reported a 42.7% YoY increase in net profit to Rs 101.3 crore in Q3FY23.

3440.30
-0.25%
Budget proposes 20% hike in TCS on overseas travel, remittances going out
Business Standard
The government on Wednesday proposed to hike the TCS rate to 20 per cent from 5 per cent currently on overseas tour packages and a liberalized remittance scheme for remittance of funds out of India. The Finance Bill, through the Budget 2023-24, amended Section 206C of the Income Tax Act levying a higher Tax Collected at Source (TCS) on overseas tour programme packages. Also, 20 per cent TCS will be applicable in cases where funds in excess of Rs 7 lakh are sent out of India under the Liberalised Remittance Scheme of the RBI. The amendments will come into effect from July 1, 2023. Nangia Andersen India Partner Amit Agrawal said the increase in TCS rate to 20 per cent is a big surprise, especially with the comfortable forex position. "The increase in TCS rates to 20 per cent for overseas travel perhaps underscores the government's intention to restrict overseas travel spending by HNI's," Agarwal said. Agarwal said the step to increase TCS to 20 per cent for all remittances, other t
Geojit BNP Paribas decreased Buy price target of Tata Consultancy Services Ltd. to 3671.0 on 23 Apr, 2025.
Trendlyne Talk
Trendlyne Talk
01 Feb 2023

Jan 2023 (New)

1) CEO Salaries Dashboard - Track the Highest paid CEOs and Directors. Sort the data feed for different stock groups or your preferred sector/industry. Example: see highest paid CEOs in IT, Banks, and Cement.

2) Trendlyne Widgets - Add widgets to your website and app by adding a single line of code: ‘Check Before You Buy’, SWOT Analysis and QVT Score on your app/website.

3) ASM and GSM Dashboard - Checkout stocks listed on the Long/Short Term Additional Surveillance Measure (ASM) and Graded Surveillance Measure (GSM) framework. The list shows active stocks and stocks which have exited the list.

Dec 2022

NSE data feed has now been shifted from 15 minutes delay to 1 minute delay. Get your analysis and alerts with minimal delay now.

1) Sign up and Sign in using email OTP  - Let go of the hassles of a password. You can now sign up and sign in with just an OTP. Visit the FAQ section for more details.

2) Track ETFs from the indices - - know the ETFs tracking the indices like Nifty 50, BSE Sensex etc.

3)Relative returns screeners now support sectors and industries. Find out which stock is outperforming or underperforming its sector or industry. Trendlyne offers you to compare a stock performance with its industry/sector for 18 different options each.

Try Query: 1Yr change % > Sector 1Yr change % and save it as your personal screener.

4) Relative Value screens launched - Compare sales growth, profit growth, PE, Price to Book, PEG etc for stocks with their sectors, industries and indices to find out the best and worst performers in valuation and growth.

Try Query:Net Profit Annual YoY Growth % > Industry Net Profit Growth Annual YoY %

Nov 2022

1) Price Target Alert now supports Mutual Funds as well - Search for your favourite mutual fund and set price alerts.

2) Earnings calls are available as a podcast now. Open this link in your favourite podcast app - https://trendlyne.com/feeds/earning-calls-podcast-rss/

3) GSM and ASM both are available from the BSE exchange. Use it in a screener or check active and exited stocks. You can find the status by clicking on the ASM icon near the stock name.

4) Insights under every stock name are available now. 

Stock Insights

Oct 2022

Forecaster Dashboard - analysts' estimates section launched. Forecaster FAQ available in the FAQ section.

- New Mobile app now has the following features:

  • Sector industry dashboard and constituents - Check out how sectors, industries and indices are faring in the market with a heat map.
  • Email alerts - Set daily alerts on quarterly results, analyst reports, and conference/earnings calls. Set hourly alerts for all corporate announcements in your watchlist and portfolio directly in your inbox.
  • Stock Groups in Screeners You now have the option to filter stocks using the stock group option in your screeners.
  • More Screeners listing - forecaster, relative valuation - You can now check if your stock is expensive or cheaper compared to its industry, sector or index. You can also checkout stocks that analysts are bullish or bearish about!
  • Navigation overhaul - Download the latest version of the app 
  • User Metric list in parameter lists - Now filter stocks from your list of metrics while browsing through screeners.
  • Index Constituents - Find what stocks exist in the index universe and how they are faring in the market.
  • Design refresh on more pages - Download the latest version of the app

Sep 2022

1) 150+ new technical parameters added to screeners. See the whole list here and search for the work "Technicals" to see all the 322 parameters available.

2) Need technical analysis on a 5 min or 15 min basis. How about 2 hours - all of these are now available on the new technical page. Checkout Infosys technicals for 5 minute trends and technicals.

Aug 2022

1) Indices, Sector and Industry dashboard - get definitive market performance breakdown for any period. Deep dive by going into the sector or Industry

July 2022

1) Segment Analysis  - Check the Sales and Profit segmentation of the companies - which business units are contributing to how much sales and profit?

2) FNO Participants wise OI - Are FIIs going long or short in derivatives, what about MF? Find the current position and comparison with past data.

May 2022

1) Compare any two stocksYou hold Infosys but wonder about TCS. You have ICICI Bank but dream about HDFC Bank. Is the grass really greener on the other side? Now you can find out with our Compare Stocks tool, where you can compare a stock with any other.

2) IPO Dashboard: The new IPO Dashboard analyzes all live and upcoming IPOs, providing strengths and weaknesses of upcoming listings as well as the performance (including gains till date) of recent listings. See the dashboard as well as details of new IPOs including LICVenus Pipes and Delhivery

3) And the Trendlyne app just got prettier and more powerful: We have added new updates, including Futures & Options and Dark Mode. Update/download the app to get the new features.

Mar 2022

-Data Downloader launched. With this you can select preferred list of metrics to download, and multiple watchlists of stocks. 

- Forecaster detailed table in Financials and in forecaster

Feb 2022

- ASM is now available on the website. Screener parameters ASM Long term stage  and  ASM Short term stageare available as premium parameters.

- Import portfolio V2 launched. Import from a excel file directly.

- Checklist launched for Debt Mutual Funds

- Company brief, directors and board salary.

Jan 2022

Forecaster is available on mobile apps

Dec 2021

Forecaster is available to GuruQ and StartQ subscribers

Oct 2021

iOS app is available on Apple Appstore

Rapid Results  lets you keep track of results as they are declared

Sep 2021

MF Checklist Check before you buy

BSE quarterly results notes are available in financial tables

Relative Performance screeners are available here

17 Aug 2021

Export Super

14 Jun 2021

Create custom parameters and use them in my metrics and screeners. Blog Post here 

8 Jun 2021

Target Price Alerts are available here

1 Jun 2021

Stock Overview page new version release with timeline for corporate events 

8 May 2021

Results PDF are now available in the financial tables for each quarter

10 Apr 2021

Superstar pages now support 9 quarters worth of history. 

06 Apr 2021

1. Stock overview - Manage metrics: You can populate your favorite metrics and parameters in the stock overview page. Insights below each parameter are also available. This solves the issue of  '"X" should be added to the list'. You have full control over it now.

Overview Metrics

31 Mar 2021

1. My Notes List: You can check all your notes from a single page from Watchlist -> My Notes. Link

2. SWOT in screeners: Premium subscribers can now query SWOT numbers in their screeners. "SWOT Strengths", "SWOT Weakness", "SWOT Threats" and "SWOT Opportunities" can now be used in screeners like:

SWOT Strengths  > 10  AND SWOT Threats  < 6   

19 Mar 2021

F&O pages: F&O pages are being revamped. 

19 Mar 2021

See Details: Click on 'see details' on any table to see the details of the stock without navigating away from the table.

See Details

10 Mar 2021

1. Save Charts configuration: Stock charts and F&O charts now have a'save configuration' option. This lets you save the studies as well as the chart type - candlestick, line or OHLC. When you navigate to the new page, this configuration is automatically loaded for you. 

2. Lifetime High and Lifetime Lows: "All Time High" and "All Time Low" are now available in the screening module for premium subscribers.

08 Mar 2021

Relative Strength screeners are available here now. Comparison parameters are available for Nifty50, Nifty500 and Sensex and parameters like Nifty50 Five Years change % as well as relative returns parameters like Relative returns vs Nifty50 five years% are also available. Try a screener like the following to fetch stocks which consistently outperform the indices using Create Screener

Qtr Change % > Nifty50 Quarter change % AND
1Yr change % > Nifty50 Year change % AND
2Yr price change % > Nifty50 Two Years change % AND
5Yr price change % > Nifty50 Five Years change % 

05 Mar 2021

We have been working on the new Stock Overview pages. The overview page now supports the following summaries

- Peer comparison radar charts under financials

- Documents now have Annual Reports, Earnings calls and Analyst presentations made by the company. This is great to hear what the management has to say about the company. Videos are also available in this section

- Technicals, Shareholding, Deals and Corporate Actions summaries are all available in a single page along with stock News.

02 Mar 2021

1. Corporate announcement alerts are now available as part of Alpha alerts as hourly and daily digests to subscribers. Add any stock to your watchlist and Portfolio and if you have the alert active, you will be notified on your email.

2. Events alerts are now available as part of Alpha alerts to all users. You will be notified on email for upcoming events like Bonus, Splits, Dividends, Result board meetings etc.

2251.00
-1.50%
Adani stocks in MFs: Index Funds and Quant Equity Funds have the maximum exposure
By Shreesh Biradar

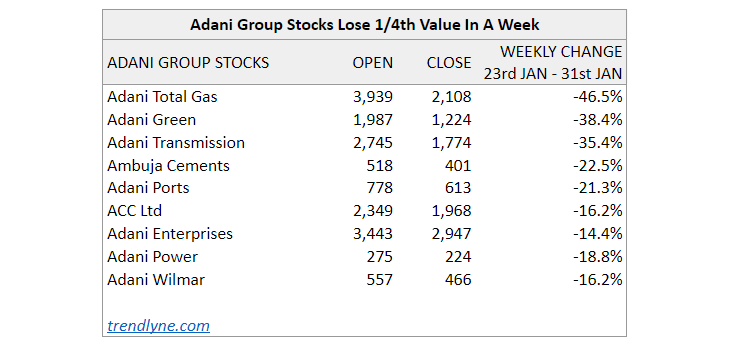
A recent research report by Hindenburg, a US-based research firm, has cast the spotlight back on India’s regulatory environment, through allegations of stock manipulation and questionable accounting practices by the Adani Group. Adani group shares have since lost nearly $40 billion market cap. While the group has rejected the allegations it has yet to address several of the points raised in the Hindenburg report, Investors are consequently wary. Most of the Adani stocks have lost more than a quarter of their value since the allegations came forth.

Note: Adani Group consists of the above set of stocks

The impact of the allegations on Adani stocks has been at varied degrees across investor segments. It affected mutual funds, Exchange Traded Funds (ETF) and banking stocks. 

Higher passive mutual fund exposure to Adani shares 

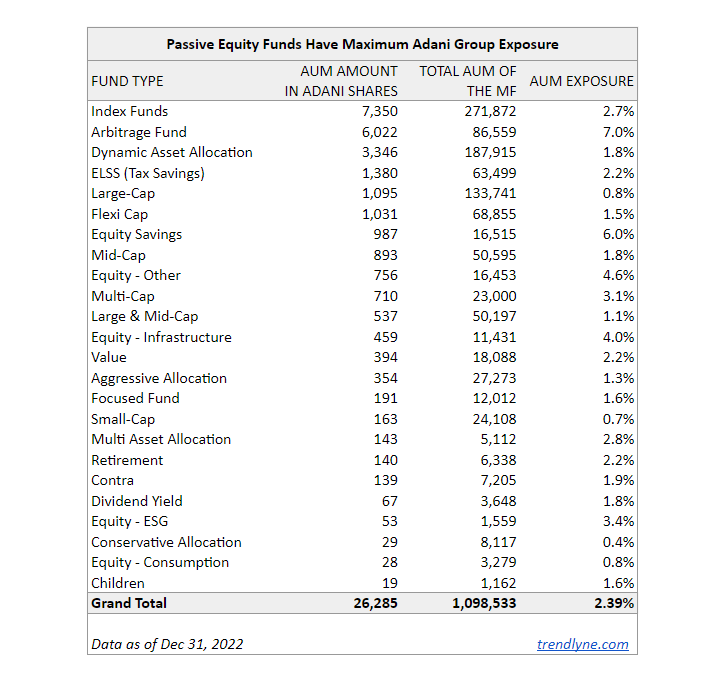
Equity mutual funds are exposed to the tune of Rs 26,285 crore towards Adani Group shares.The highest exposure has been to Ambuja Cements, ACC and Adani Ports, which constitute nearly 60% of the total exposure of mutual funds. Actively managed funds have stayed away from the Adani group as a whole, Fund managers are skeptical of its valuations and debt overhang.

Index funds which are passive in nature constitute nearly 28% of the exposure. As long as Adani stocks are part of Nifty Indices, ETFs cannot get into selling these stocks. Adani Ports and Adani Enterprises are part of Nifty 50, while Adani Green and Adani Transmission find their place in Nifty Next 50. Index funds are followed by arbitrage funds, which constitute nearly 23% of total mutual fund exposure towards the Adani group. These are mostly algorithm-driven with minimal human intervention.

Note: All values in Rs crore

Among  fund houses, Quant Fund (11.07%) and Taurus Asset Management (10.90%) will have the biggest impact on NAV due to the Adani group fallout. While SEBI does not allow mutual funds to invest more than 10% of their portfolio in a single issuer, the guidelines are not clear when it comes to group entities.

Most big fund houses like HDFC, Axis, ICICI and SBI have stayed away from Adani group stocks, limiting their exposure below 4%. 

Motilal Oswal and Kotak Mahindra have been the exception with 5.31% and 4.54% exposure respectively. Equity Mutual Funds have an exposure of 2.39%.

Note: All values in Rs crore

Nifty 50 index ETFs are having exposure of 2.09%, whereas Nifty Next 50 ETFs have 14%. The recent run-up of Adani group stocks has led to higher exposure of ETFs.

Funds with greater than 10%+ exposure have see a bigger drop in Net Asset Value

Among actively managed funds, Quant schemes feature in funds with greater than 10% exposure to Adani group. Mutual funds are designed to diversify investments, so even a concentrated 15-stock portfolio will not have more than 6-8% exposure to a single group. 

Schemes with 10%+ exposure have seen NAV drop by 3-4%, considering the recent rout in Adani stocks. Even savings schemes, which are considered to be conservative and risk-averse, have seen a high degree of exposure to a single group.

Note: All values in Rs crore

The recent sell-off in the market was dominated by the retail segment, while FPIs and mutual funds did not fully participate. Fitch group had cited concerns over Adani group’s leverage levels earlier. This was in August 2022, before the recent allegations broke out. Adani group, in response, had stated that they were in a sound financial position and reducing their debt levels. The recent allegations by Hindenburg are different as it’s not about the group’s financial condition but more about governance and misappropriation. Even though the group has denied the allegations, its stocks are still tumbling on the bourses.

Adani Enterprises Ltd. has an average target of 3801.00 from 1 broker.
2251.00
-1.50%
Adani Enterprises could continue to guzzle capital given its aggressive investment plans
By Deeksha Janiani

After a forgettable start to the new year, markets are set to swing into action as India’s biggest follow-on offer will hit the floor on January 27. Adani Enterprises, which went public in 1994, seeks to raise Rs 20,000 crore as part of its long-term capital management plan. 

Meanwhile, Hindenburg Research, a US-based investment research firm has come out with a detailed report alleging “brazen” stock manipulation and accounting fraud by the Adani Group. In response, the conglomerate said that the report “was timed with malicious intent” to discredit the company ahead of its FPO. But Adani has yet to respond to the details of the allegations, and share prices of group companies like Adani Transmission, Adani Total Gas and Adani Ports fell by over 5% after the report’s release. 

Adani Enterprises (AEL) is the flagship company and the incubator of new businesses for the Adani group. The company derives its revenues mainly from trading imported coal in India. It is also working on a green hydrogen ecosystem, data centres, development of airports and roads, digital platforms, defence and industrial manufacturing. 

FPO is a bid to enhance the pool of retail shareholders  

Prior to this proposed issue, AEL had raised Rs 7,700 crore from an Abu Dhabi-based investment company in May 2022. Now, it seeks to diversify its shareholder base. “Our intention is to expand our share registry with focus on India's retail investors,” as Gautam Adani, chairperson at Adani group, puts it. 

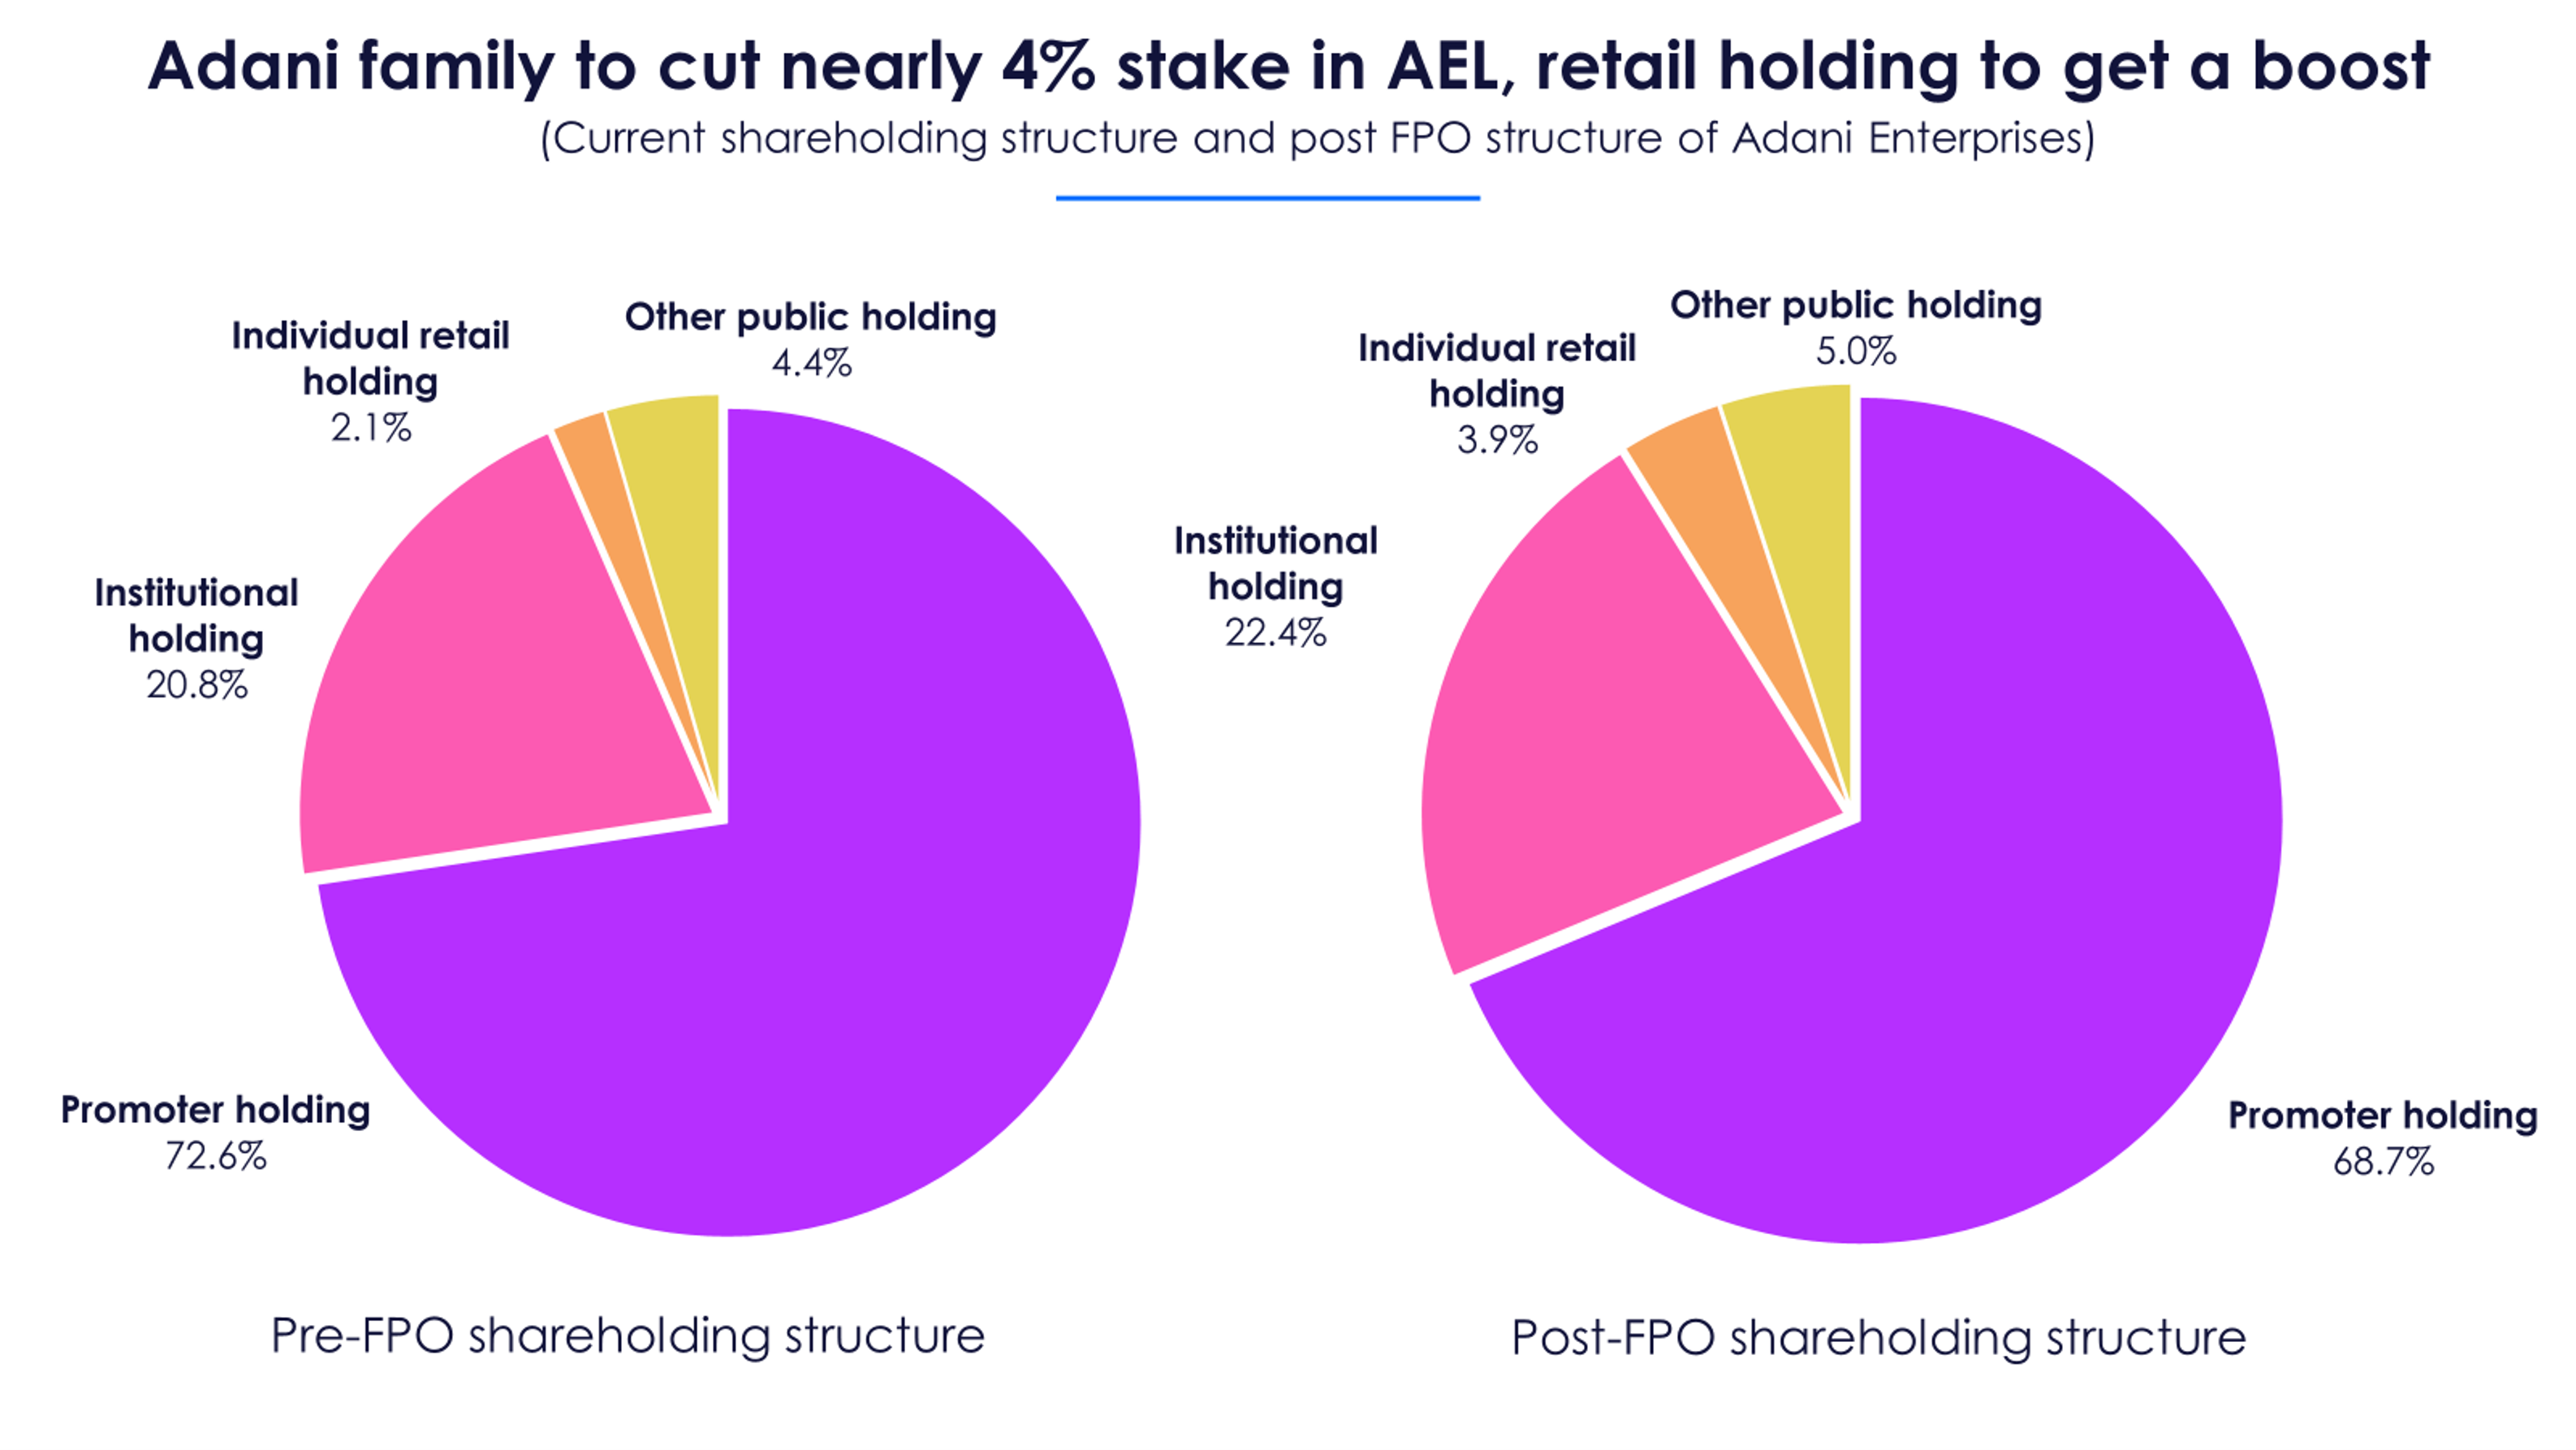
The promoter family will reduce around 3.9% stake in the company post this offer. The free float or the shares available for public trading will rise to around 31%. Notably, the stake of individual retail holders will rise by over 1.8X. This is the section of holders who actively trade in the market, unlike institutional holders who tend to sit tight on their investments.

This is expected to  improve the trading volumes and liquidity of the stock and its prices will be less prone to wild movements. This could also correct the sky-high valuations of this Adani stock. Notably, the company is issuing partly paid-up shares which will be converted to the main line only after the remaining payment is completed within 18 months. 

Major share of proceeds earmarked for energy and infrastructure projects

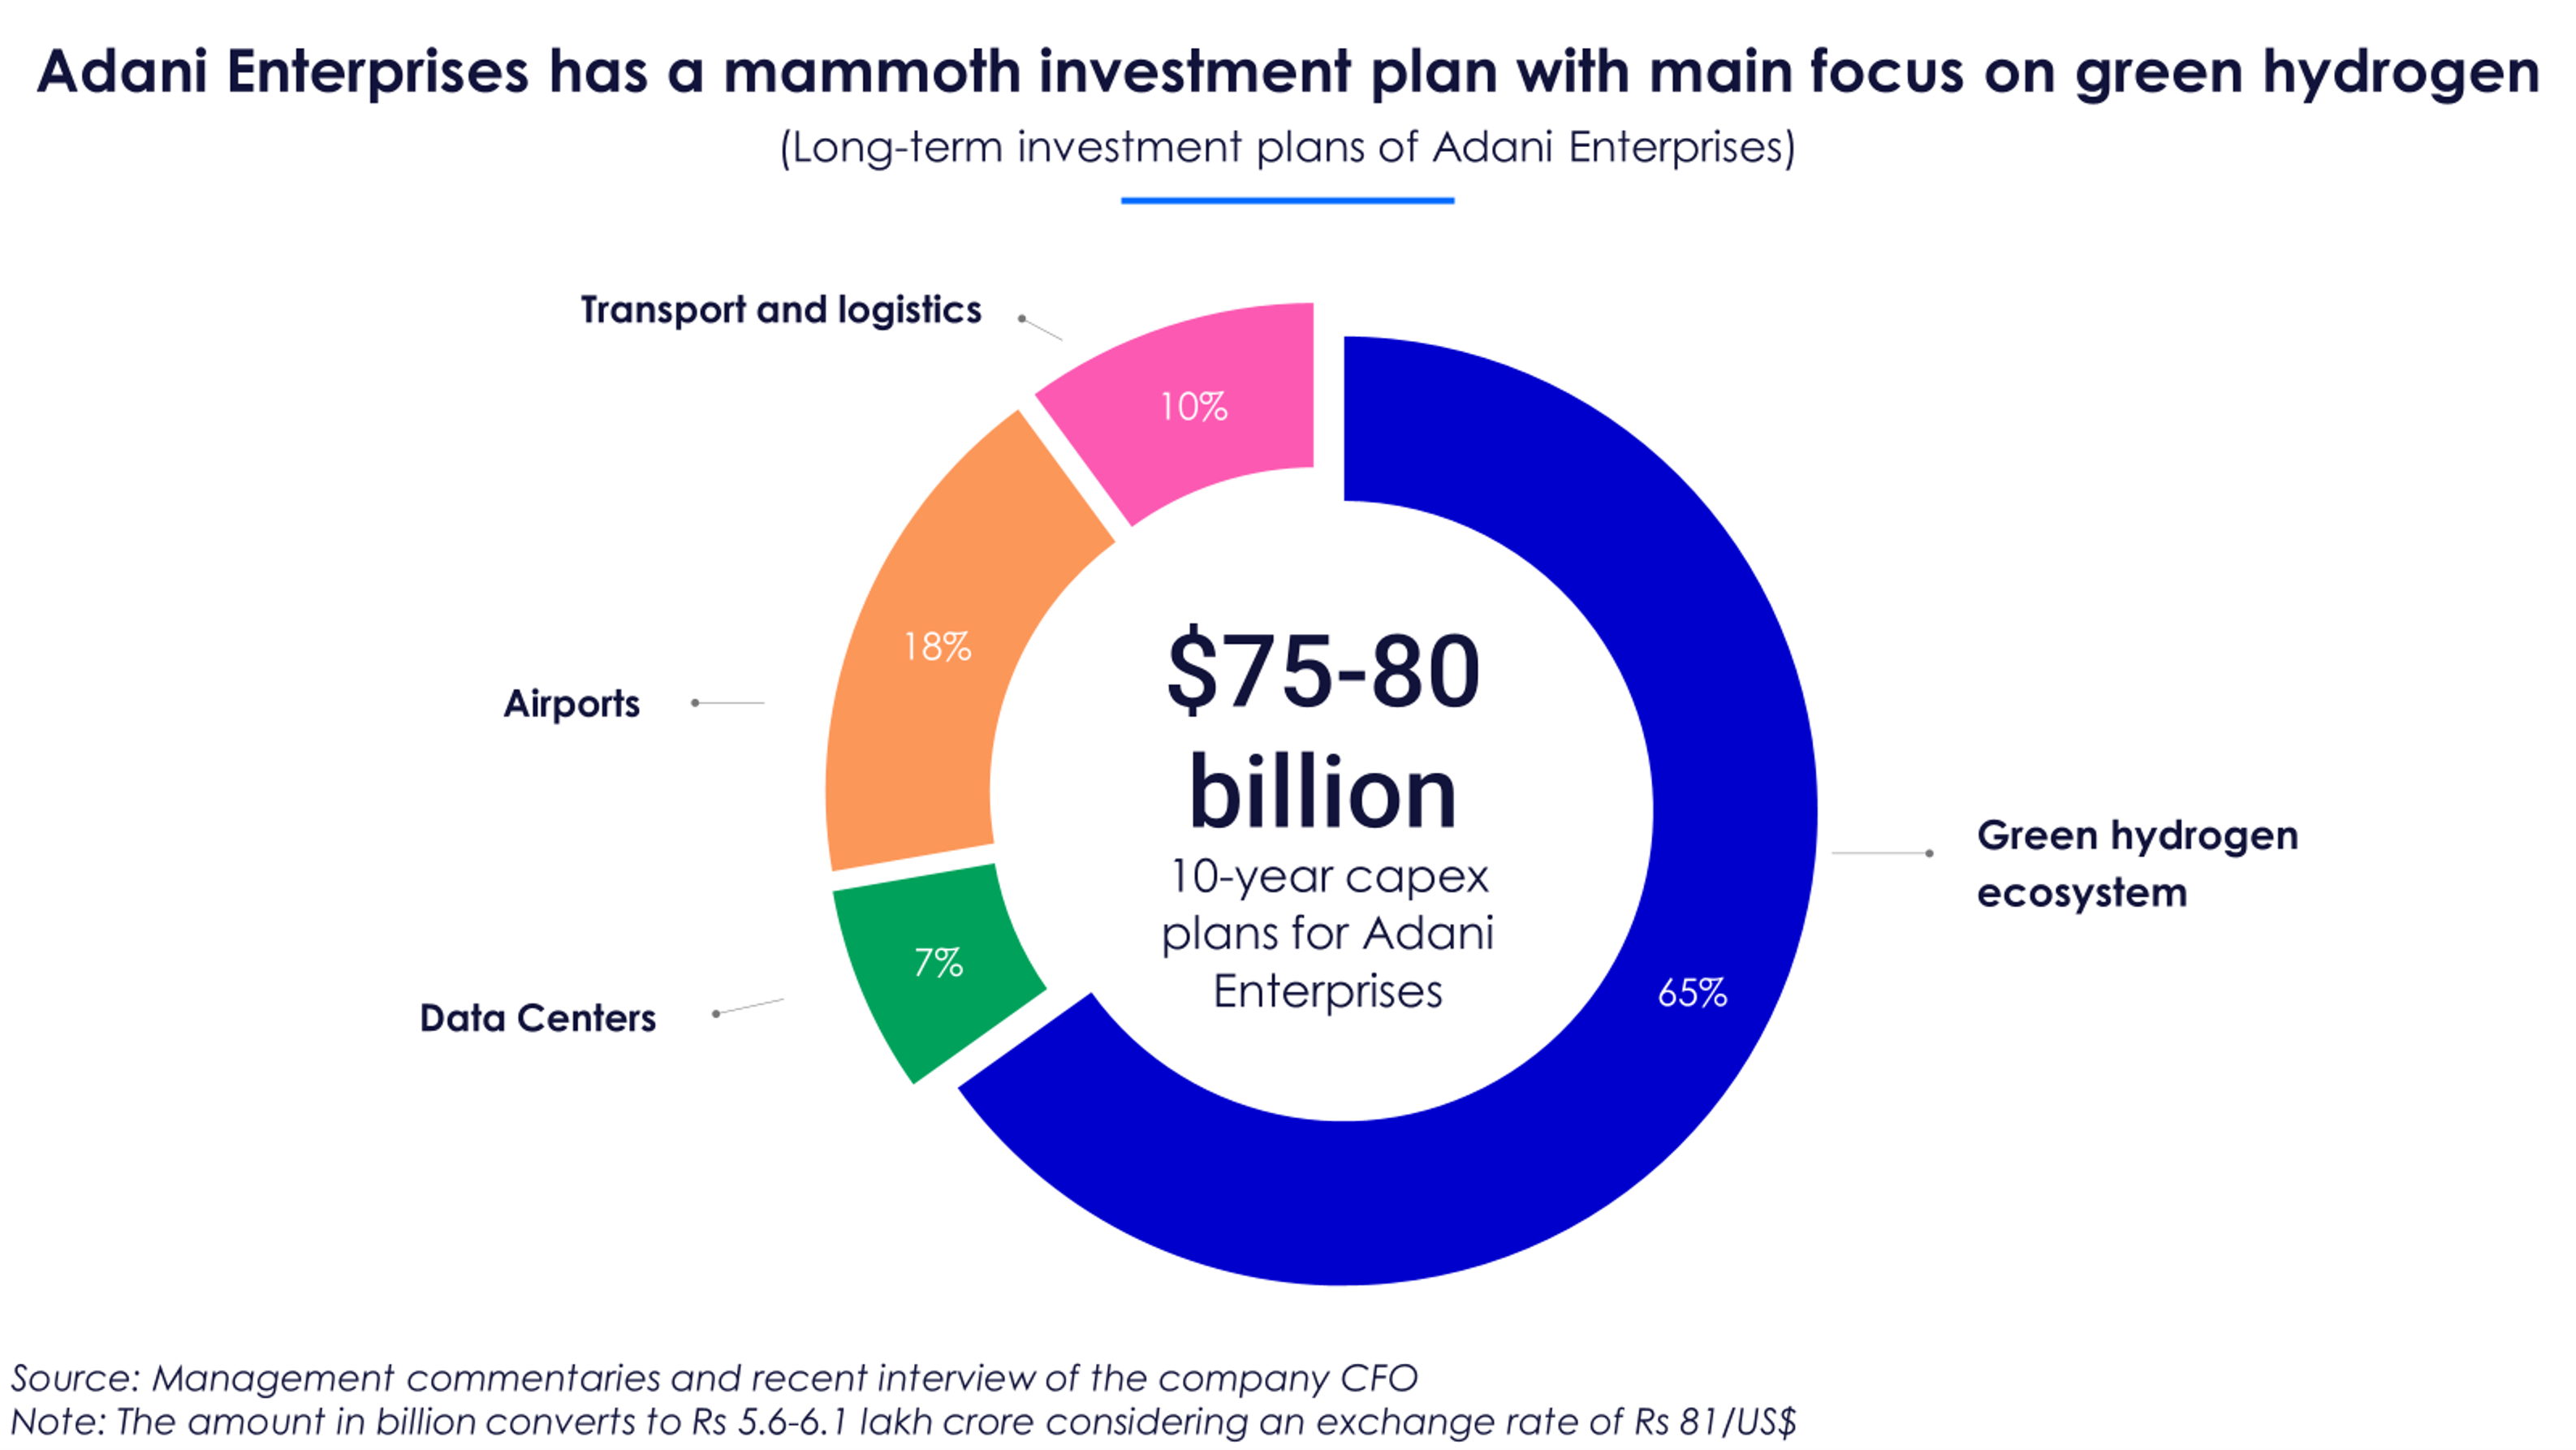
Adani Enterprises intends to utilize over half of the offer proceeds towards its capex projects involving airports, roads and expressways, and the green hydrogen ecosystem. Of the amount set aside for capex, improvement of airports, especially the ones in Ahmedabad and Lucknow, will claim a major chunk. 

While this plan is well-intended, the amount earmarked for capital spends looks like a drop in the ocean considering the company’s long-term plans. According to Jugeshinder Singh, Chief Financial Officer at Adani Group, the entire group has a 10-year capex plan of $107 billion, within which AEL has roughly 70-75% share. 

A major part of AEL’s investments will go into building the green hydrogen ecosystem. This is a developing technology, which is yet to be proven commercially. Currently, generating hydrogen through renewable energy sources costs twice as much as producing it using natural gas (gray hydrogen). The company will have to build it on a huge scale for it to be viable for the use of heavy industries. 

Apart from its capex projects, AEL plans to repay some of its existing debt via the offer proceeds. However, this repayment will reduce the borrowings of the company by only 10%. 

On a positive note, the total debt-to-equity metric for AEL will fall below 1X post this FPO. 

Adani Enterprises is hard-pressed for free cash with a high debt burden

Adani Enterprises is investing in projects which typically have a long gestation period. Hence, the magnitude of its existing cash flows is important in gauging if it can fund its own growth or  if it will continue to require capital infusion. 

AEL witnessed over 65% fall in its operating cash flows in FY22, owing to an inventory build-up. It also generated negative free cash of over Rs 10,000 crore owing to higher capex. Interestingly, its operating cash improved considerably in H1FY23 due to a jump in operational profits. However, the company was still not able to post positive free cash in this period. 

Given AEL’s long-term plans, it should ideally have an annual capex run-rate of Rs 60,000-65,000 crore. This is hard to achieve with its existing cash flows. Hence, it’s possible that AEL may not generate positive free cash for a long time. Its operations won’t make enough cash to pay its financiers or pay dividends to shareholders. 

The recent allegations question the accuracy of these accounting numbers itself. The absence of a well-known statutory auditor and the constant attrition among CFOs were some key concerns highlighted in the report

Rising debt burden is another cause of concern for Adani Enterprises. The company’s net debt to EBITDA ratio rose to alarming levels in FY22, as its borrowings more than doubled. Although it has come down in H1FY23, the metric is still outside the comfort zone. Another red flag is the consistent fall in the interest coverage metric between FY21 and H1FY23. 

The management of AEL does not consider its debt level to be a concern despite a declining  ability to service it. Its argument is that most of its debt is housed in upcoming businesses, which it plans to demerge anyway.

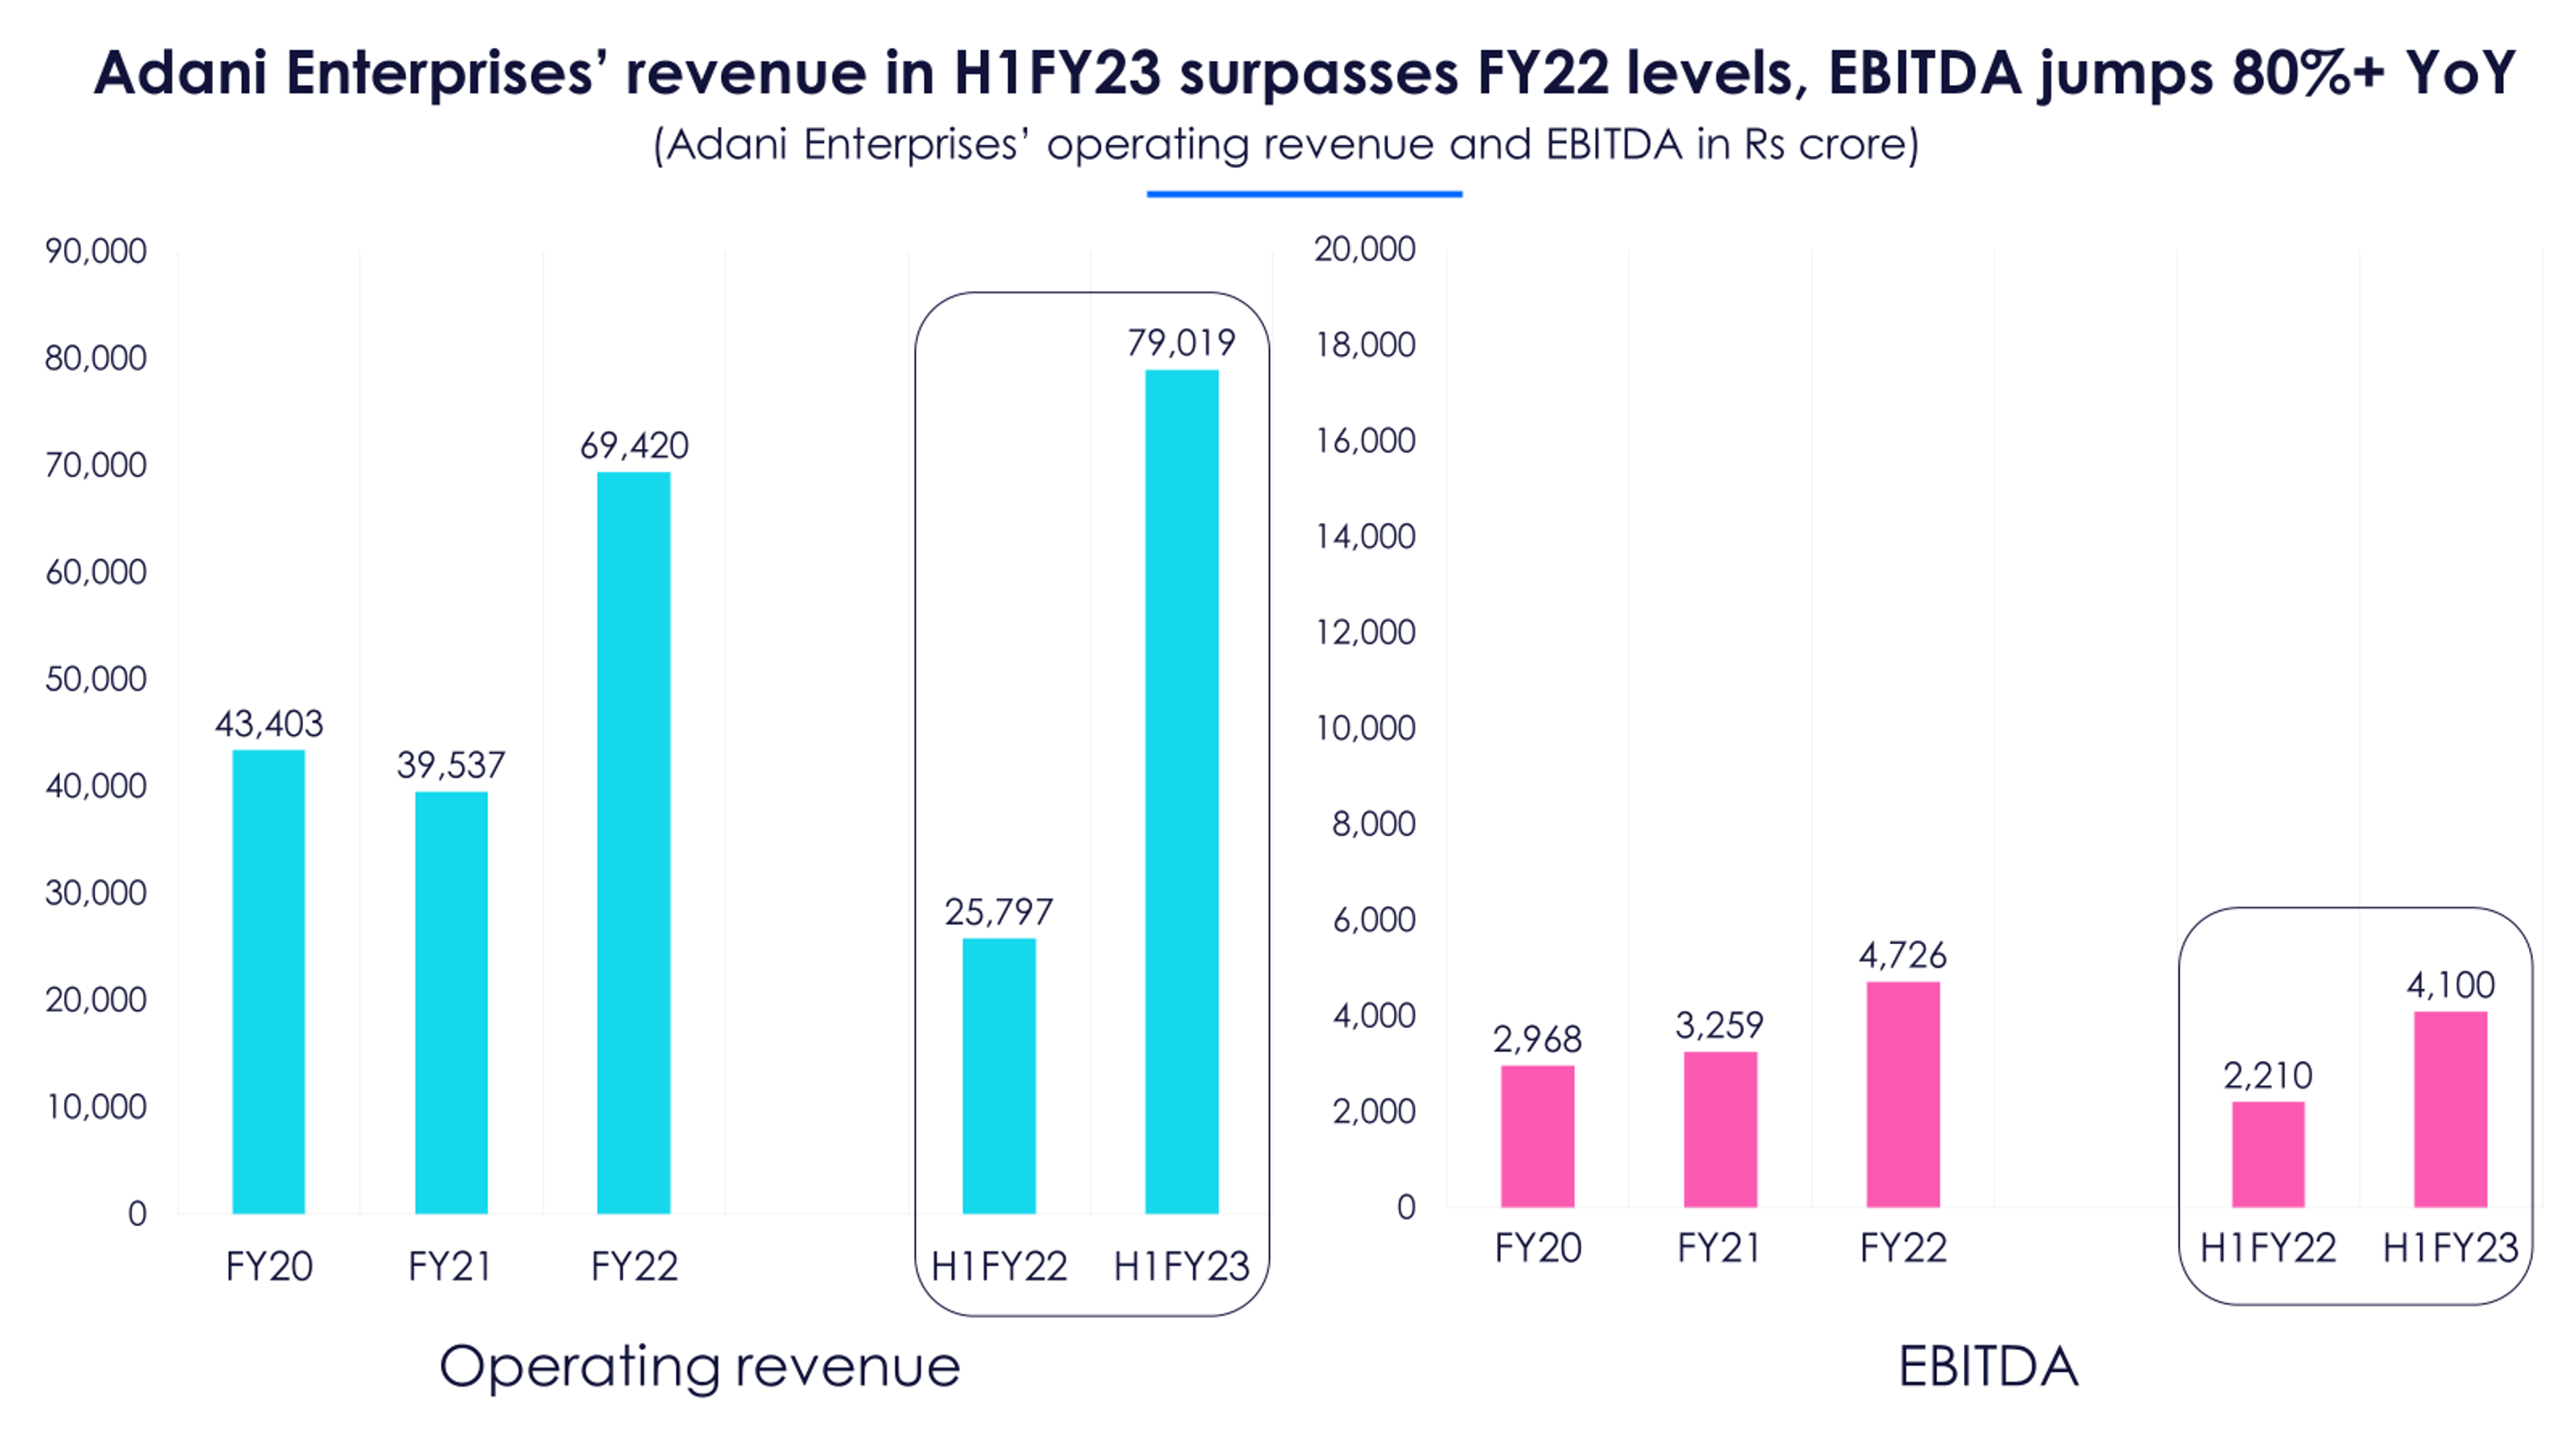
Adani Enterprises’ fortunes revived in H1FY23

Adani Enterprises’ revenue and EBITDA grew at a CAGR of over 25% between FY20 and FY22. However, its net profits fell by more than 20% in this period. The jump in finance costs and depreciation weighed negatively on the earnings of the company. This is quite natural as the company has continued to expand aggressively with the aid of higher debt. 

Interestingly, the company’s operating metrics have improved in H1FY23. Its top line and bottom line in H1FY23 exceeded FY22 levels as well. The flagship division of integrated resource management and the airport segment were the main drivers of this growth. 

However, AEL is not able to put its capital to effective use. The company’s return on capital employed has continued to fall and nearly halved to 6.2% between FY20 and H1FY23. This is despite a jump in its operational profits in H1FY23. 

At this rate, the company would be better off by putting its capital in a fixed deposit in India. Additionally, it is not able to meet the average cost of capital which was at 11.5% for the infrastructure industry, according to a latest RBSA Advisors’ report. This raises the question if Adani Enterprises is biting off more than it can chew.

A bet on the Indian growth story, but at what cost?

Ahead of the Adani Enterprises’ FPO, Gautam Adani commented on the opportune timing of this issue – “Most of our growth is still ahead of us; our growth plan is aligned with the Indian growth story, with our capabilities and with the needs of India’s retail shareholders.” But the question here is how much are you as an investor shelling out for AEL’s future, not-yet-realized  growth.

The offer is priced at a discount of 5-10% for retail shareholders, considering its price bands and the closing price on January 25. However, AEL’s stock will be available at an average PE of over 290X. ‘Pricey’ is an understatement for such a valuation multiple. 

Large-cap companies like UPL and Tata Power have high debt levels and posted negative free cash in H1FY23. But, these have a much smaller PE multiple in comparison and generated negative returns in the past year. 

Adani Enterprises has an ambitious plan to set up a green hydrogen project of three million metric tonnes, data centres of 1GW and a road portfolio of 12,000 lane km in the next 10 years. It’s indeed dreaming big as it lacks the operational wherewithal to do so. 

This FPO might just be the start to a series of equity/debt fundraises that AEL may have to undertake in the future.

Adani Enterprises Ltd. has lost -23.15% in the last 6 Months
logo
The Baseline
25 Jan 2023
Chart of the week: India’s ten highest-paid CEOs
By Abdullah Shah

Chief Executive Officer (CEO) salaries are a hot topic and closely followed by both investors and analysts. An extremely generous pay package can be routine for an industry, or a red flag for a low-performing company, suggesting corporate governance norms in the business are weak. 

In this edition of chart of the week, we look at India’s 10 highest-paid CEOs and their remuneration as a percentage of the company’s net profit, according to Trendlyne’s new CEO Salary dashboard

This interactive dashboard on Trendlyne looks at the total remuneration of senior employees (including CEOs and directors) in the industry. The remuneration is inclusive of benefits like ESOPs.

The IT sector is known for highly paid CEOs and it is reflected in the chart as well. Six of the 10 highest-paid CEOs are from the IT sector. Yashish Dahiya, Chairman, Executive Director and CEO of loss-making PB Fintech (PolicyBazaar), tops the list with a remuneration of Rs 613.8 crore. It constituted 39.6% of the company’s annual revenue in FY22 (keep in mind ESOPs are a big part of remuneration for listed startups, and the value of shares is tied to company performance). The company posted losses during the same period. As per the company’s FY22 annual report, in the scenario of the company incurring losses, Yashish Dahiya is subject to receive ESOP 2020 and 2021 as minimum remuneration. 

Vinay Vinod Sanghi, Chief Managing Director and CEO of CarTrade Tech, received a remuneration of Rs 176.6 crore, which comes to almost half of the company’s annual revenue in FY22.

Thierry Delaporte, Managing Director and CEO of Wipro, got Rs 79.8 crore after an increment of 24% in 2022. Salil S Parekh, Managing Director and CEO of Infosys, got a remuneration of Rs 71 crore after four consecutive increments of 327.9%, 1.2%, 188.3% and 43% in 2019, 2020, 2021 and 2022 respectively. Infosys used to be known in the industry for its lower pay scale for management, with the founders arguing that the CEO salary relative to the median employee shouldn’t be too high. That has clearly changed - Parekh is one of the highest paid CEOs in India.

CP Gurnani, Managing Director and CEO of Tech Mahindra, received Rs 62.7 crore, which constituted 1.1% of the company’s net profit in FY22. He received two increments of 304.5% in 2021 and 335.4% in 2022. Sandeep Kalra, Executive Director and CEO of Persistent Systems, earned Rs 46.9 crore, which was 6.8% of the company’s net profit. 

Two CEOs from the 2-3 wheeler industry also feature in the top 10 list. Pawan Munjal, Chairman and CEO of Hero MotoCorp, earned a remuneration of Rs 84.4 crore, constituting 3.6% of the company’s profit. Managing Director and CEO of Bajaj Auto, Rajiv Bajaj, received Rs 45.6 crore constituting 0.74% of the company's profit.

Another notable name in the list is Punit Goenka, Managing Director and CEO of Zee Entertainment Enterprises. He received a remuneration of Rs 41.1 crore, making up 4.3% of the company’s net profit. After taking a pay cut during the Covid pandemic in 2020, he received two increments of 46% in 2021 and 212.2% in 2022.

You can find more details on the remuneration of CEOs and directors on Tredlyne’s newly launched Salary Dashboard

logo
HFCL Ltd.
23 Jan 2023
74.14
-1.68%
Sign In   to see Rapid results content
Vijay Kishanlal Kedia
18 Jan 2023
Portfolio X-Ray: Vijay Kedia’s SMILE is his investing secret
By Abhiraj Panchal

Vijay Kishanlal Kedia, born in Kolkata, is an Indian investor based out of Mumbai. He began investing in the stock market at the age of 19 years and started Kedia Securities in 1992, when he was 33. 

Speaking about his investment rationale in an interview, Kedia had said, “One should scout for companies which have good management... find a very good management, a very honest management and see the product in which the management is going to grow, going to outperform its peers and the economy. Invest in those companies for the next 10-15 years, and you cannot go wrong." According to reports, he uses the SMILE approach in investment–‘small in size, medium in experience, large in aspiration, and extra-large in market potential’. 

As of end-Q2FY23, Kedia’s net worth is Rs 770.7 crore, and he publicly holds stakes in 16 stocks. The best-performing stock in his portfolio is Tejas Networks, a telecom service company. The stock price of the company has risen 11x since it was added to his portfolio in June 2020. 

The marquee investor bought a stake in pharmaceutical company Neuland Laboratories in Q3FY20 and in textile company Vaibhav Global in Q4FY17. Their stock prices have also risen by 308.2% and 285.4%respectively since the purchase. The oldest best-performing stocks in the portfolio are specialty chemicals company Sudarshan Chemical Industries and furnishing company Cera Sanitaryware, both bought in FY16. Their stock prices have increased 243.7% and 164.0% respectively in the past seven years. Kedia also earned approx 181.3% returns from Elecon Engineering, which was added to the portfolio in Q1FY22.

Interestingly, Kedia has held all the negative-performing stocks in his portfolio since before December 2015. It suggests that Kedia doesn’t let go of underperformers easily - perhaps hoping for an eventual recovery. 

Kedia sold a part of his stake in Lykis (he held 2.7% Q2FY23 before selling to below 1% in Q3FY23), a personal products company, in Q2FY23. Its stock price has fallen 49.6% since Q3FY16. The second worst-performing stock is Atul Auto (auto components manufacturer). Its stock price has dipped 48.6%, followed by Panasonic Energy India (electronic components company), which fell 29.5%. Stock price of Repro India, a publishing company, has also decreased by 22.4%.  

Telecom services, general industrials and textile among Kedia’s preferred sectors

The marquee investor has 30.1% of his portfolio invested in the telecom services sector, aggregating to Rs 218.4 crore. He has 16.8% in general industrials, 13.1% in textiles, apparels and accessories, and 9.7% in diversified consumer services. Hotels, restaurants and tourism amounts to 7.4%, and chemicals and petrochemicals amounts to 5.2%. 

Commercial services and supplies, automobiles and auto components, pharmaceuticals and biotechnology, FMCG, cement and construction, and software and services occupy less than 5% each of the portfolio.

Kedia’s portfolio has been dormant in terms of new buys or additions during Q2FY23 except for a minor stake addition in Elecon Engineering, an industrial machinery company.  In Q3FY23, from the data available, he has not made any additions yet.

As for cutting stakes, Kedia sold a 6.6% stake in Lykis, an FMCG company, in Q2FY23, while the company announced a 113.1% YoY rise in profit and 28.2% increase in revenue for the same quarter. He reduced his Affordable Robotic & Automation stake to 12.3% in Q2FY23 from 14.2% in Q4FY22. He also cut a 0.3% stake in Ramco Systems and a minor stake in Tejas Networks.

n Q3FY23 (from the most recent available data), Kedia has sold a 0.3% stake in Tejas Networks (now holds 2.3%), a 1% stake in Talbros Automotive Components (now holds 1.3%) and cut his stake in Lykis to below 1%.

Most companies in Kedia’s portfolio were profitable last quarter

Only three companies in the portfolio have reported a loss for Q2FY23–Ramco Systems, Panasonic Energy India and Atul Auto. Even while reporting profit, seven companies have fallen YoY in net profit and two in revenue. Ramco Systems has dipped 15.7% YoY in revenue and suffered a loss of Rs 60.3 crore. Neuland Laboratories reported an 88.8% rise in net profit and Elecon Engineering had an 82.3% growth in profit during the same period.

From the portfolio, eight stocks that outperformed their respective industries, include Affordable Robotic & Automation, Elecon Engineering, Atul Auto and Tejas Networks. Ten companies have outperformed their industry over a quarter and eight outperformed over a month.

Cera Sanitaryware has the highest basic annual EPS of Rs 116.2, followed by Neuland Laboratories (Rs 49.74), Talbros Automotive Components (Rs 36.36) and Heritage Foods, a packaged foods company, (Rs 20.81).

Around 11% of the companies in the portfolio trade in the PE Buy Zone and PE Sell Zone each. Neuland Laboratories trades in PE Buy Zone, while Vaibhav Global trades in PE Sell Zone. The rest of the companies trade in PE Neutral Zone.

Meanwhile, the PE of all stocks in Kedia’s portfolio is above their respective sectors, proving that he prefers stocks with good valuations relative to their sectors.

How volatile is Kedia’s portfolio?

The beta for 10 stocks in Kedia’s portfolio is below 1 for a year, and 6 stocks are greater than 1. However, six stocks have a beta below 1 for a quarter. The average beta of the portfolio for a year is 0.89, whereas it is 1.14 for a quarter. 

To conclude, Kedia prefers stocks that are not as volatile as the benchmark index in the long run. He also prefers stocks with strong valuations. Kedia’s portfolio doesn’t see frequent changes, and he holds on to stocks for long periods. To quote the marquee investor, while luck plays a big part in stock market investments, knowledge, courage and patience are the cornerstones.

logo
Shalby Ltd.
17 Jan 2023
181.49
-0.35%
Sign In   to see Rapid results content