

Earnings season is underway, and no one is bursting fireworks yet. The early performance has been muted.
Heavyweights such as Bajaj Finance and Kotak Mahindra Bank took hits after reporting disappointing results. On the other hand, Eternal (Zomato) surprised with good numbers, thanks to its quick commerce segment Blinkit growing rapidly, and the stock shot up.
Overall, the mood on the street is not super upbeat.
The mixed earnings have weighed on sentiment, and the Nifty 50 is down 3% in July. But if you zoom out, the bigger picture still looks good: the index is up 4.5% for 2025 and on course for its tenth straight year of gains. Over the past two decades, it has ended the year in the red only three times.
The positive trend for the Nifty is expected to continue in 2025. Nomura Research says, “With Indian fundamentals holding up amid global weakness, we’ve raised our Nifty target to 26,140 as select domestic-oriented sectors continue to outperform”.
Looking past the short-term, have the top sectoral Nifty indices beaten the Nifty50 in the past few years? Let’s find out.
In this week’s Analytics,
-
Sectoral plays: Which Nifty index comes out on top?
-
Screener: Stocks outperforming the Nifty over the past year, with rising momentum scores

Two decades of sector performance: what worked, what didn't?
Over the last five years, investors seeking returns have been drawn to sectors such as Nifty Realty, Nifty Auto, and Nifty Metal, which have delivered impressive absolute returns. Six out of eight major sectoral indices beat the benchmark Nifty 50 over this period.
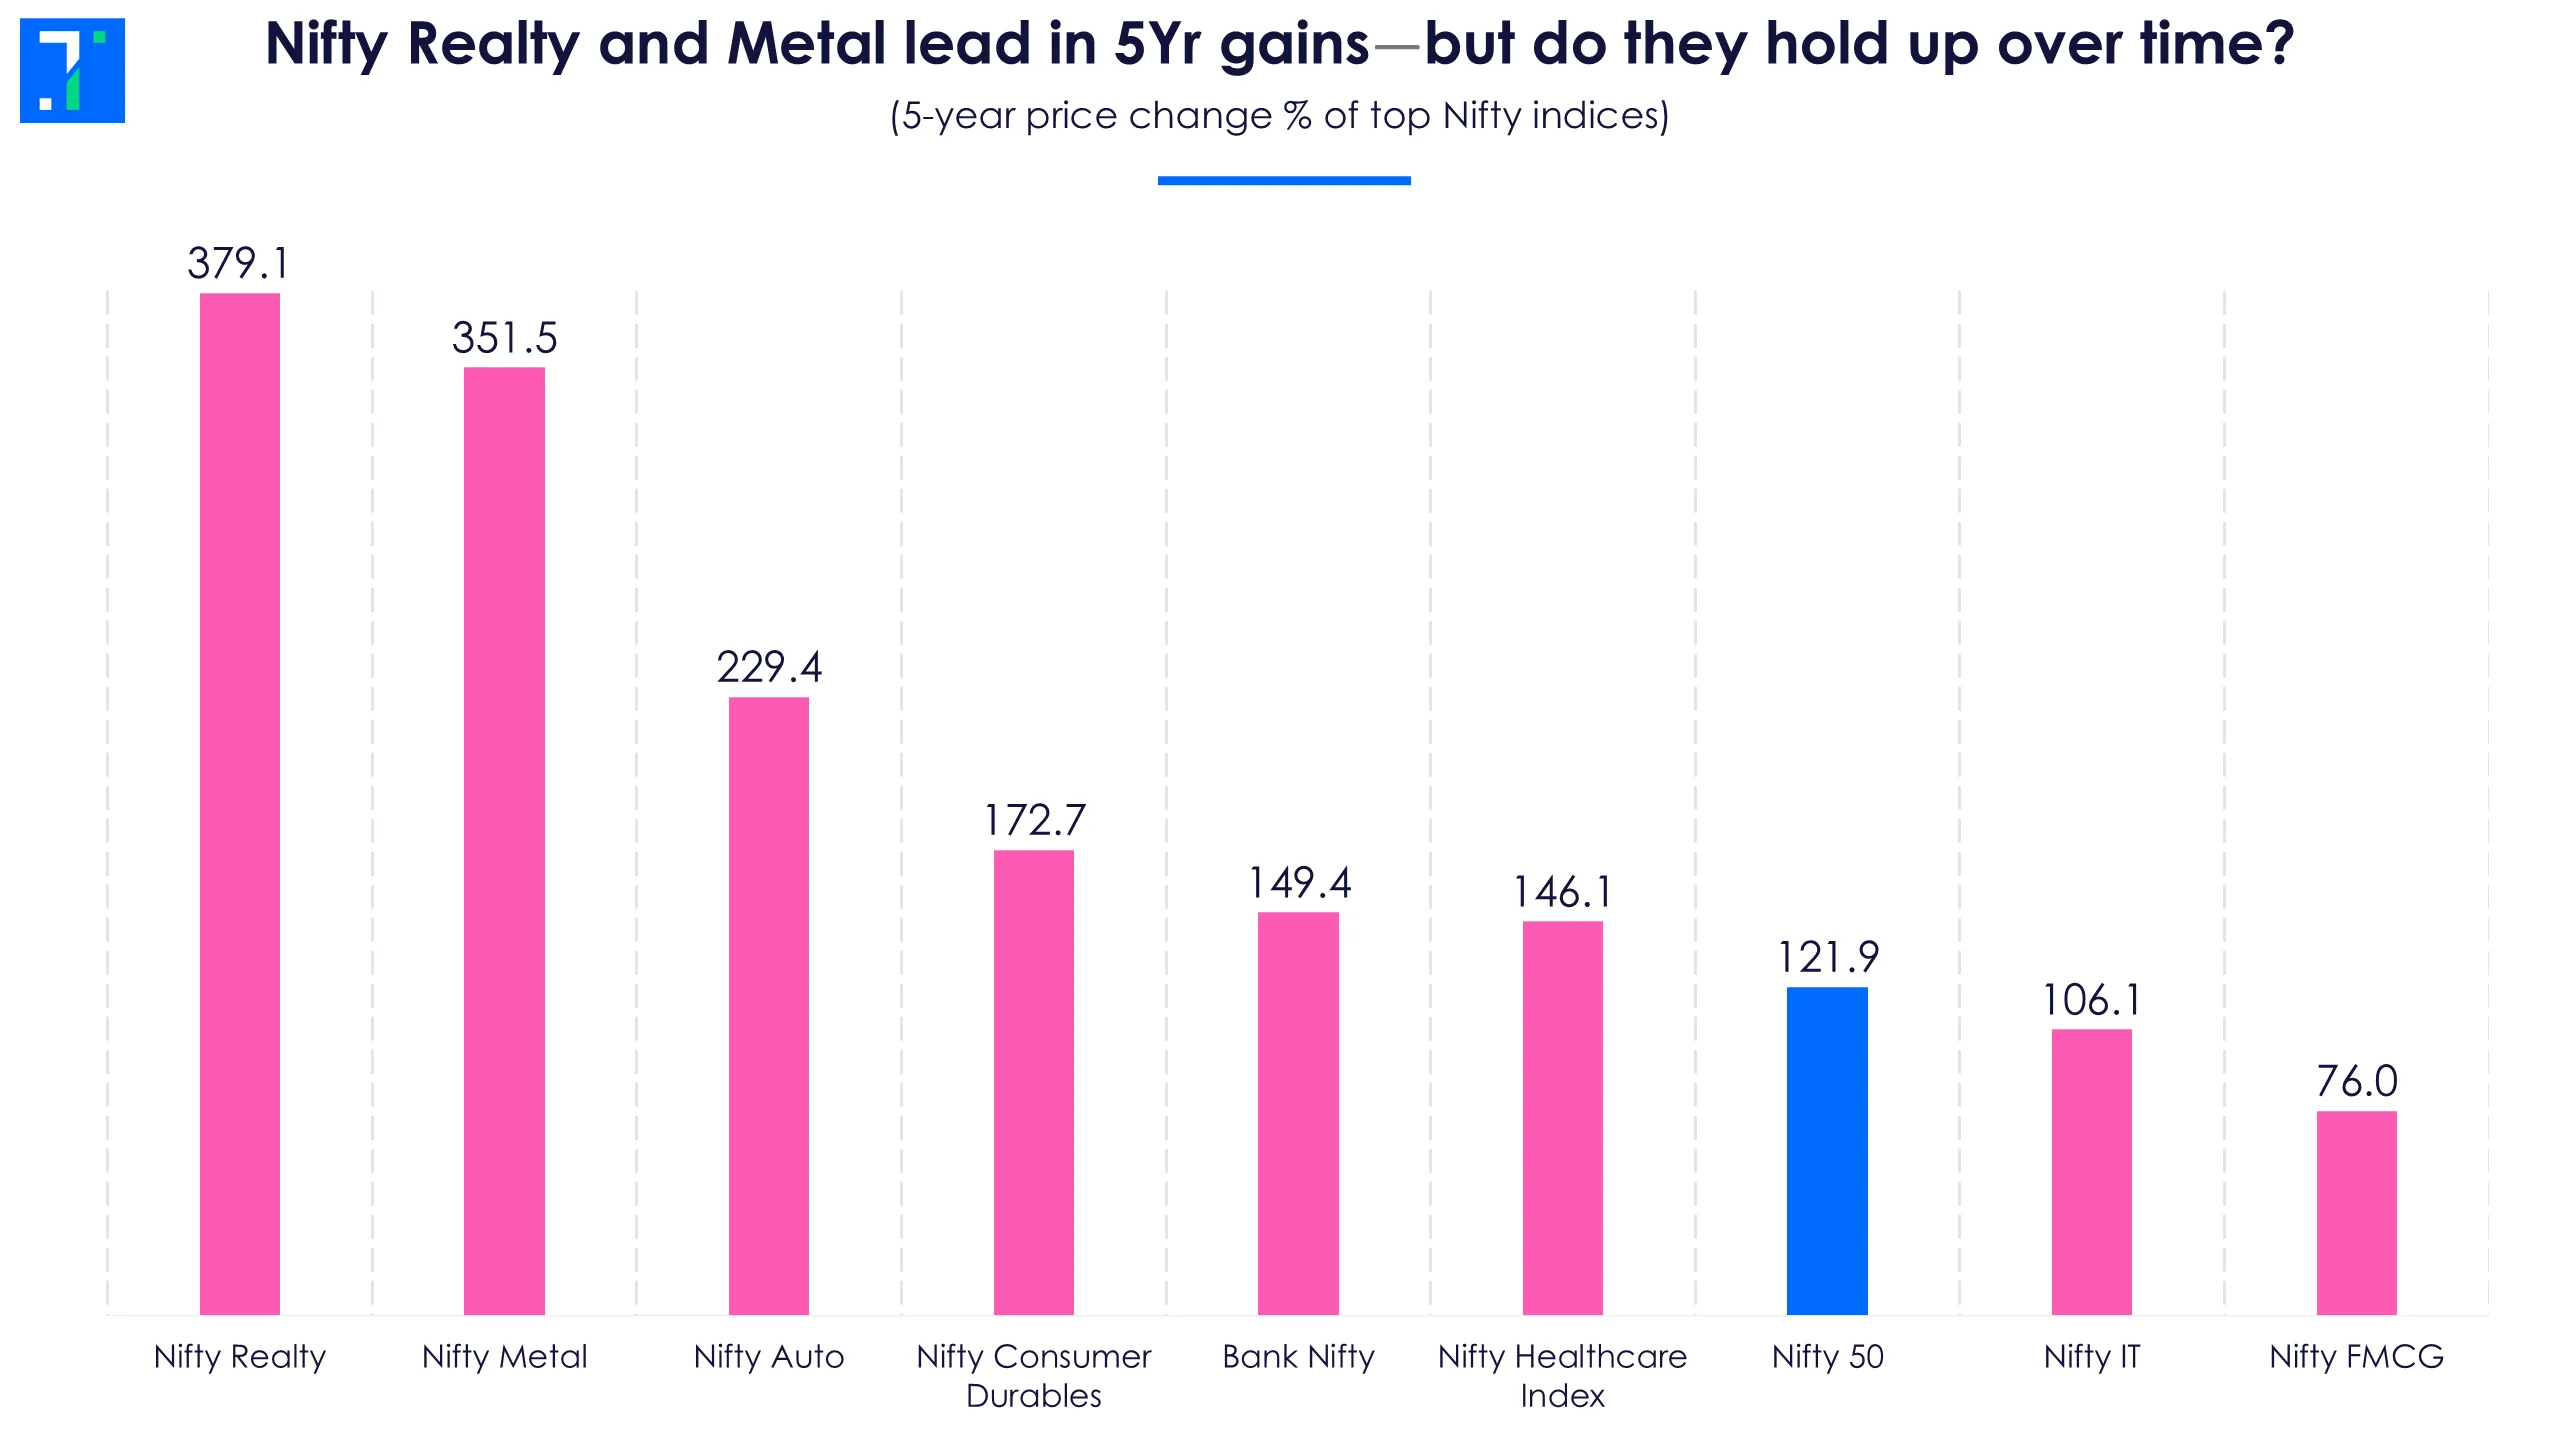
Nifty Realty and Metal lead in 5Yr gains—But do they hold up over time?
But if we dig deeper using Trendlyne’s share price analysis tool and check performance through the lens of risk-adjusted returns and a 20 year period, a different picture takes shape.
Returns vs risk: Nifty Healthcare and Consumer Durables race ahead
To get a clear view of sector performance, we analysed the median return and standard deviation of top sectoral indices over the last twenty years, covering multiple market upcycles and downturns.
If we just look at the previous chart, Nifty Realty looks like a star performer with the highest five year gain. But it is also one of the most volatile indices. Its median return is just 5%, the lowest among the eight, compared to the Nifty 50’s 13.5%.
Realty also has the second-highest standard deviation, signaling a moody index that takes its investors on a roller coaster ride. When it does well, it's spectacular. When it does badly, it is a portfolio killer. During the 2008 housing crash, it tanked 83% in a single year, a stark reminder of its cyclical nature.
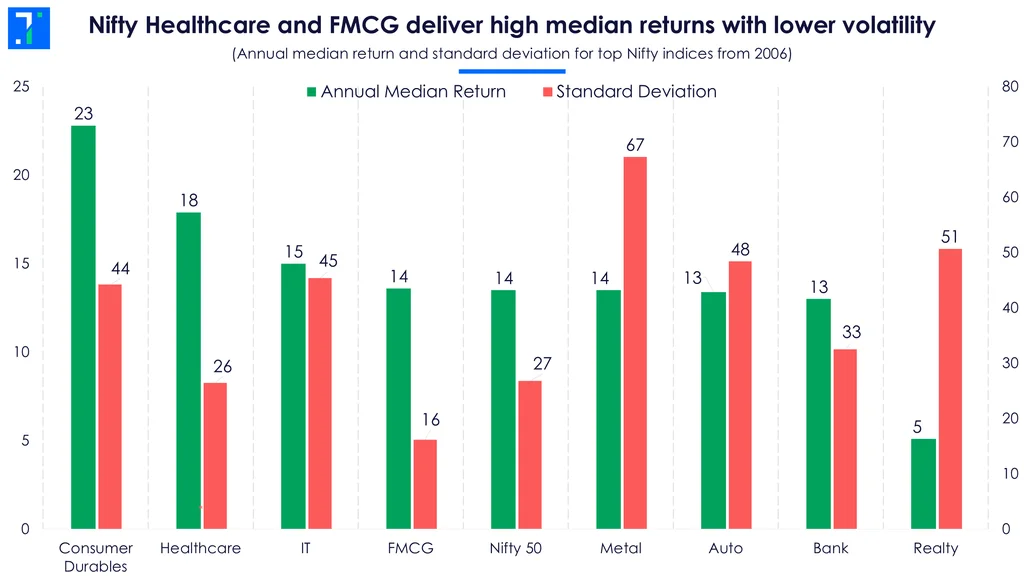
Nifty Healthcare and FMCG deliver high median returns with lower volatility
In contrast, the Nifty Consumer Durables and Nifty Healthcare indices stand out for their strength and stability. Consumer Durables delivered a strong median return of 23%, while Healthcare followed with 18%, both comfortably ahead of the broader index.
What sets Healthcare apart is not just return, but risk. With a standard deviation even lower than the Nifty 50, it offers a rare mix of high returns and low volatility—a stable combination for long-term investors. Everyone needs healthcare, even during lean times.
Beating the cycles: who is the 20 year outperformer?
If you are looking for consistency, look no further than the Nifty 50 itself.
Over the past 20 years, the index has ended in the red in only three years: 2008, 2011, and 2015. It's now on track for a tenth consecutive year of gains.
Among sectoral indices, Nifty FMCG has been the most stable, closing in the green in 80% of the 20 years.
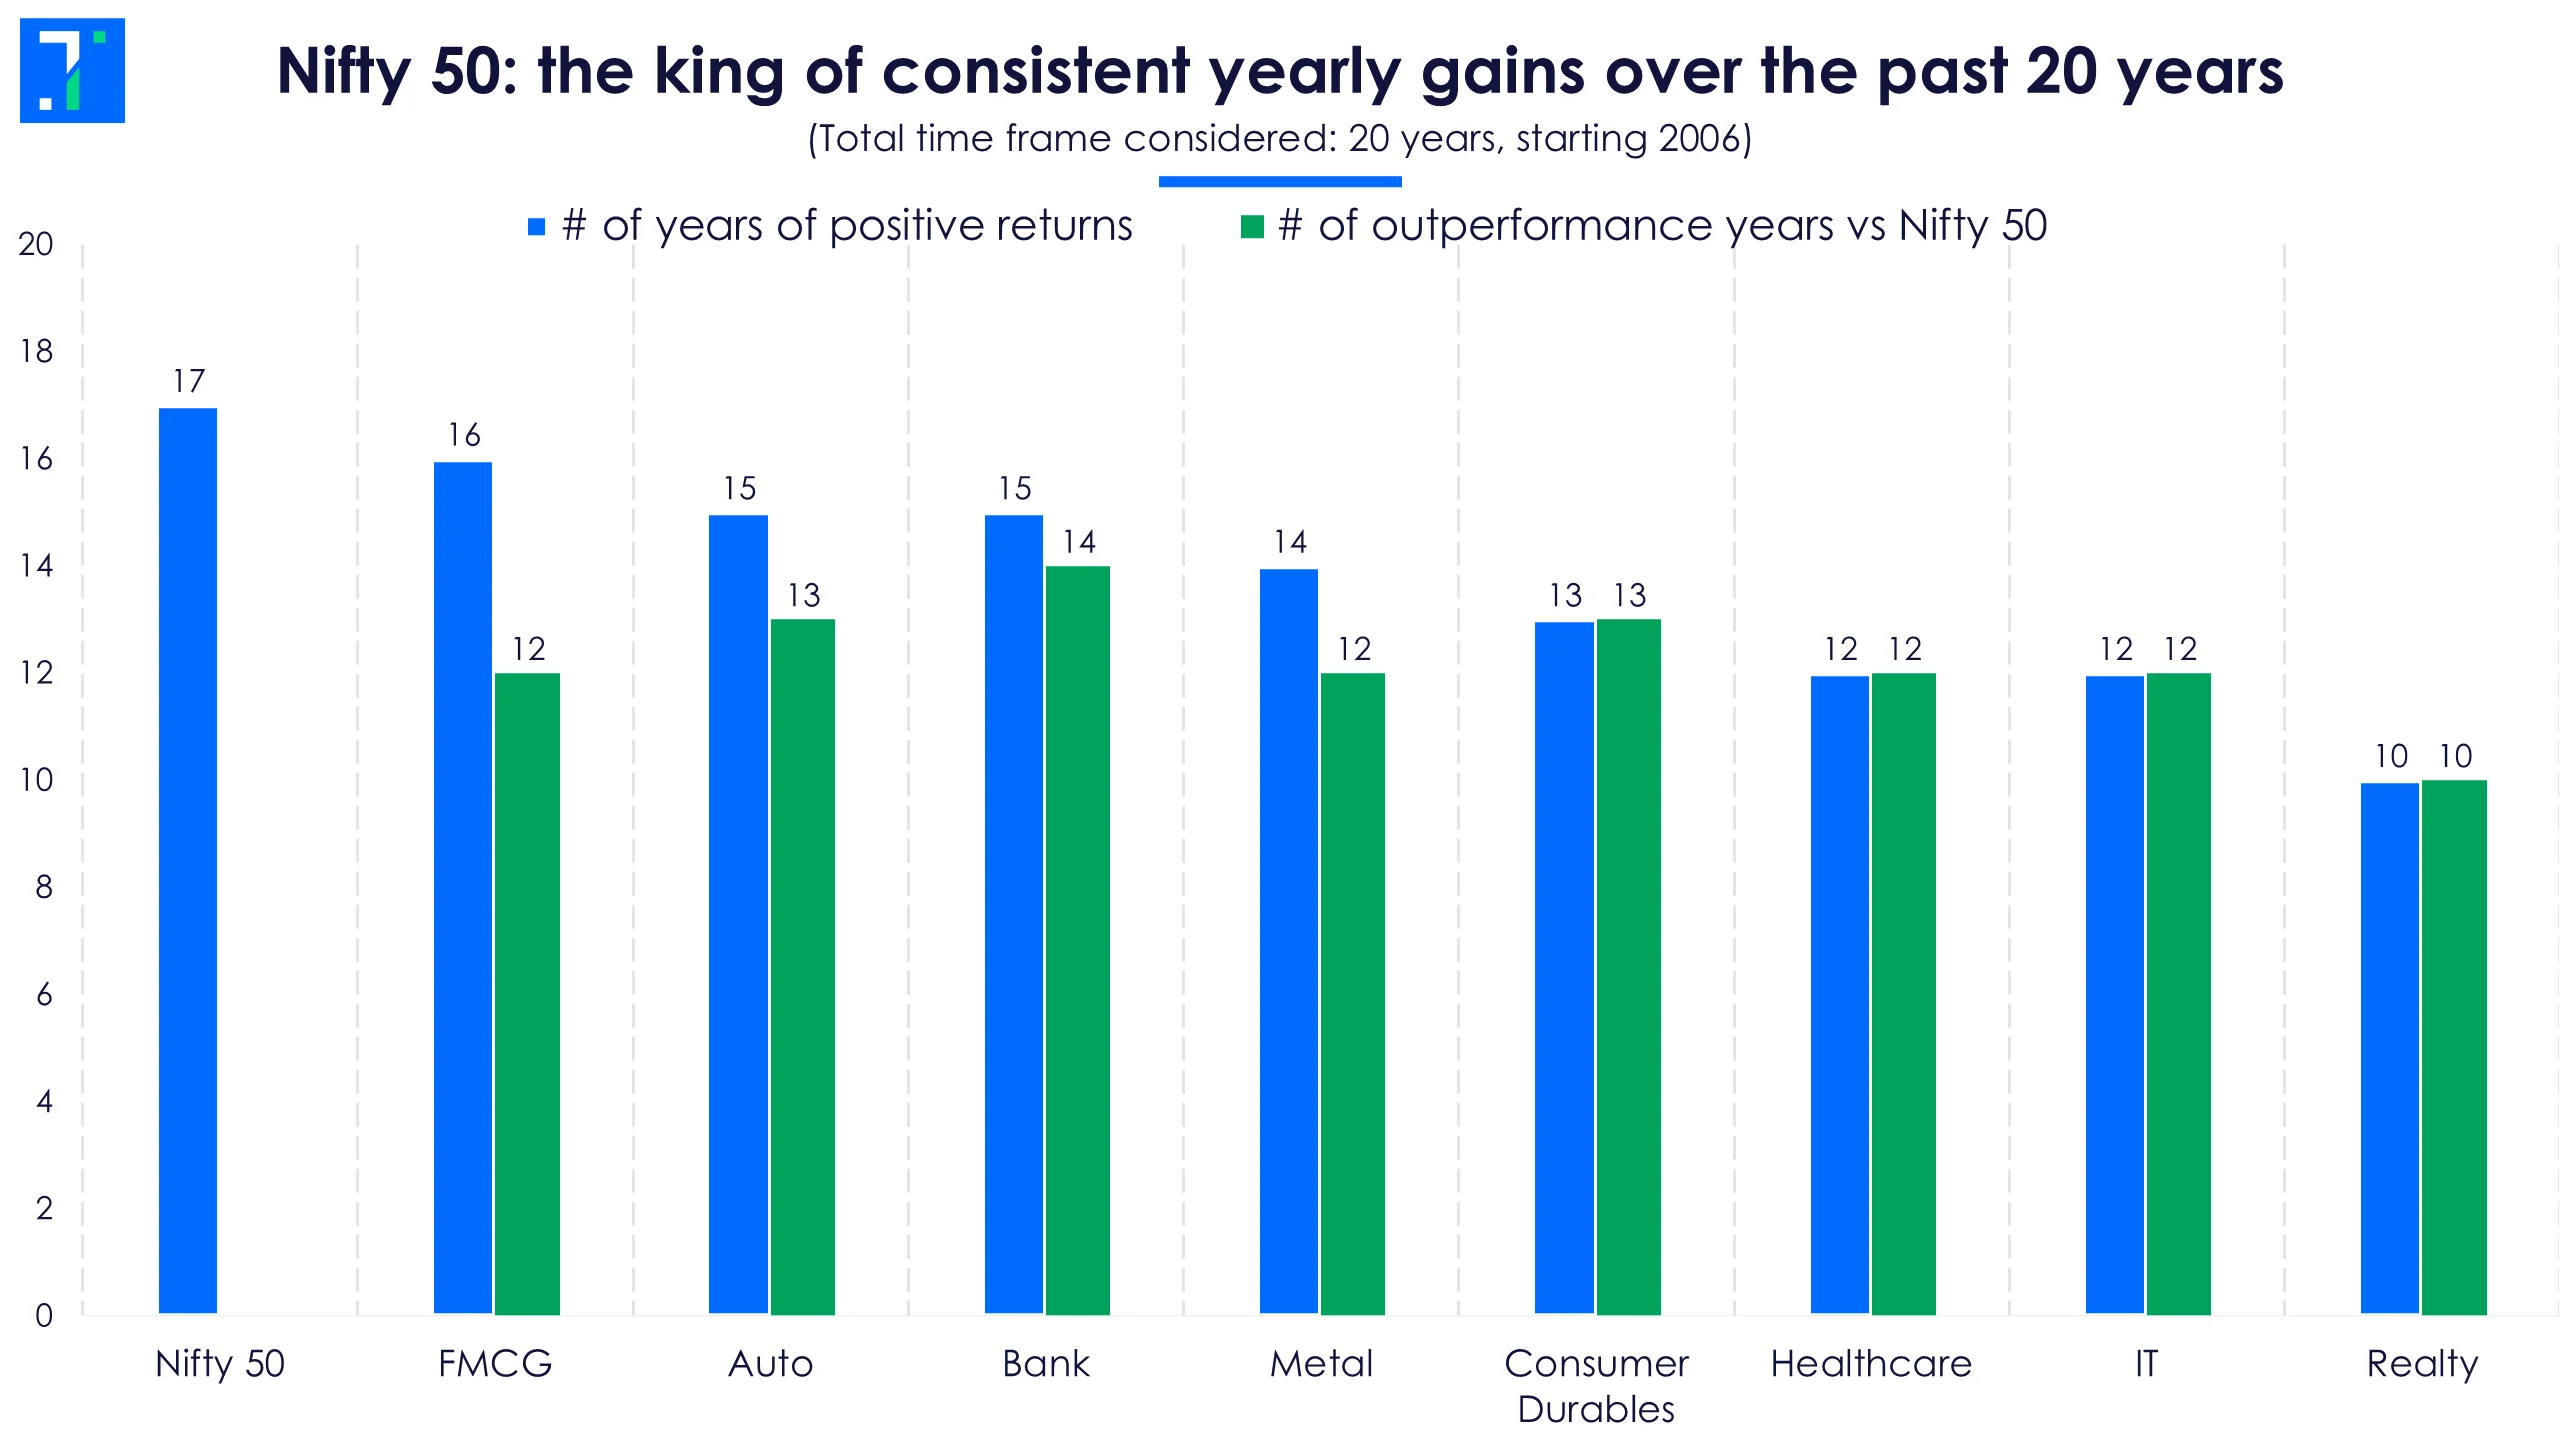
Nifty 50: the king of consistent yearly gains over the past 20 years
Nifty FMCG has shown its defensive strength during volatile periods, posting positive returns in both 2011 and 2015, when the Nifty 50 fell. In 2011, it outperformed the benchmark by a staggering 32 percentage points, cementing its reputation as a go-to sector in uncertain times.
When it comes to outperformance, Bank Nifty comes out on top, beating the Nifty 50 in 14 out of 20 years. Consumer Durables and Auto follow closely, outperforming in 13 of those years.
Which sector is in the spotlight now?
Over the past year, only Nifty Healthcare and Nifty Bank have emerged as the major sectoral indices that outperformed the Nifty 50. Interestingly, both carry lower beta than the index, meaning they are less sensitive to market swings.
Vinod Nair, head of research at Geojit Investments, said “Optimism is building around the possibility of a favorable India-US trade deal, especially after the trade deal between the US and European Union (EU) suggests lower-than-expected tariff rates. This could help ease uncertainty around Indian pharma exports”.
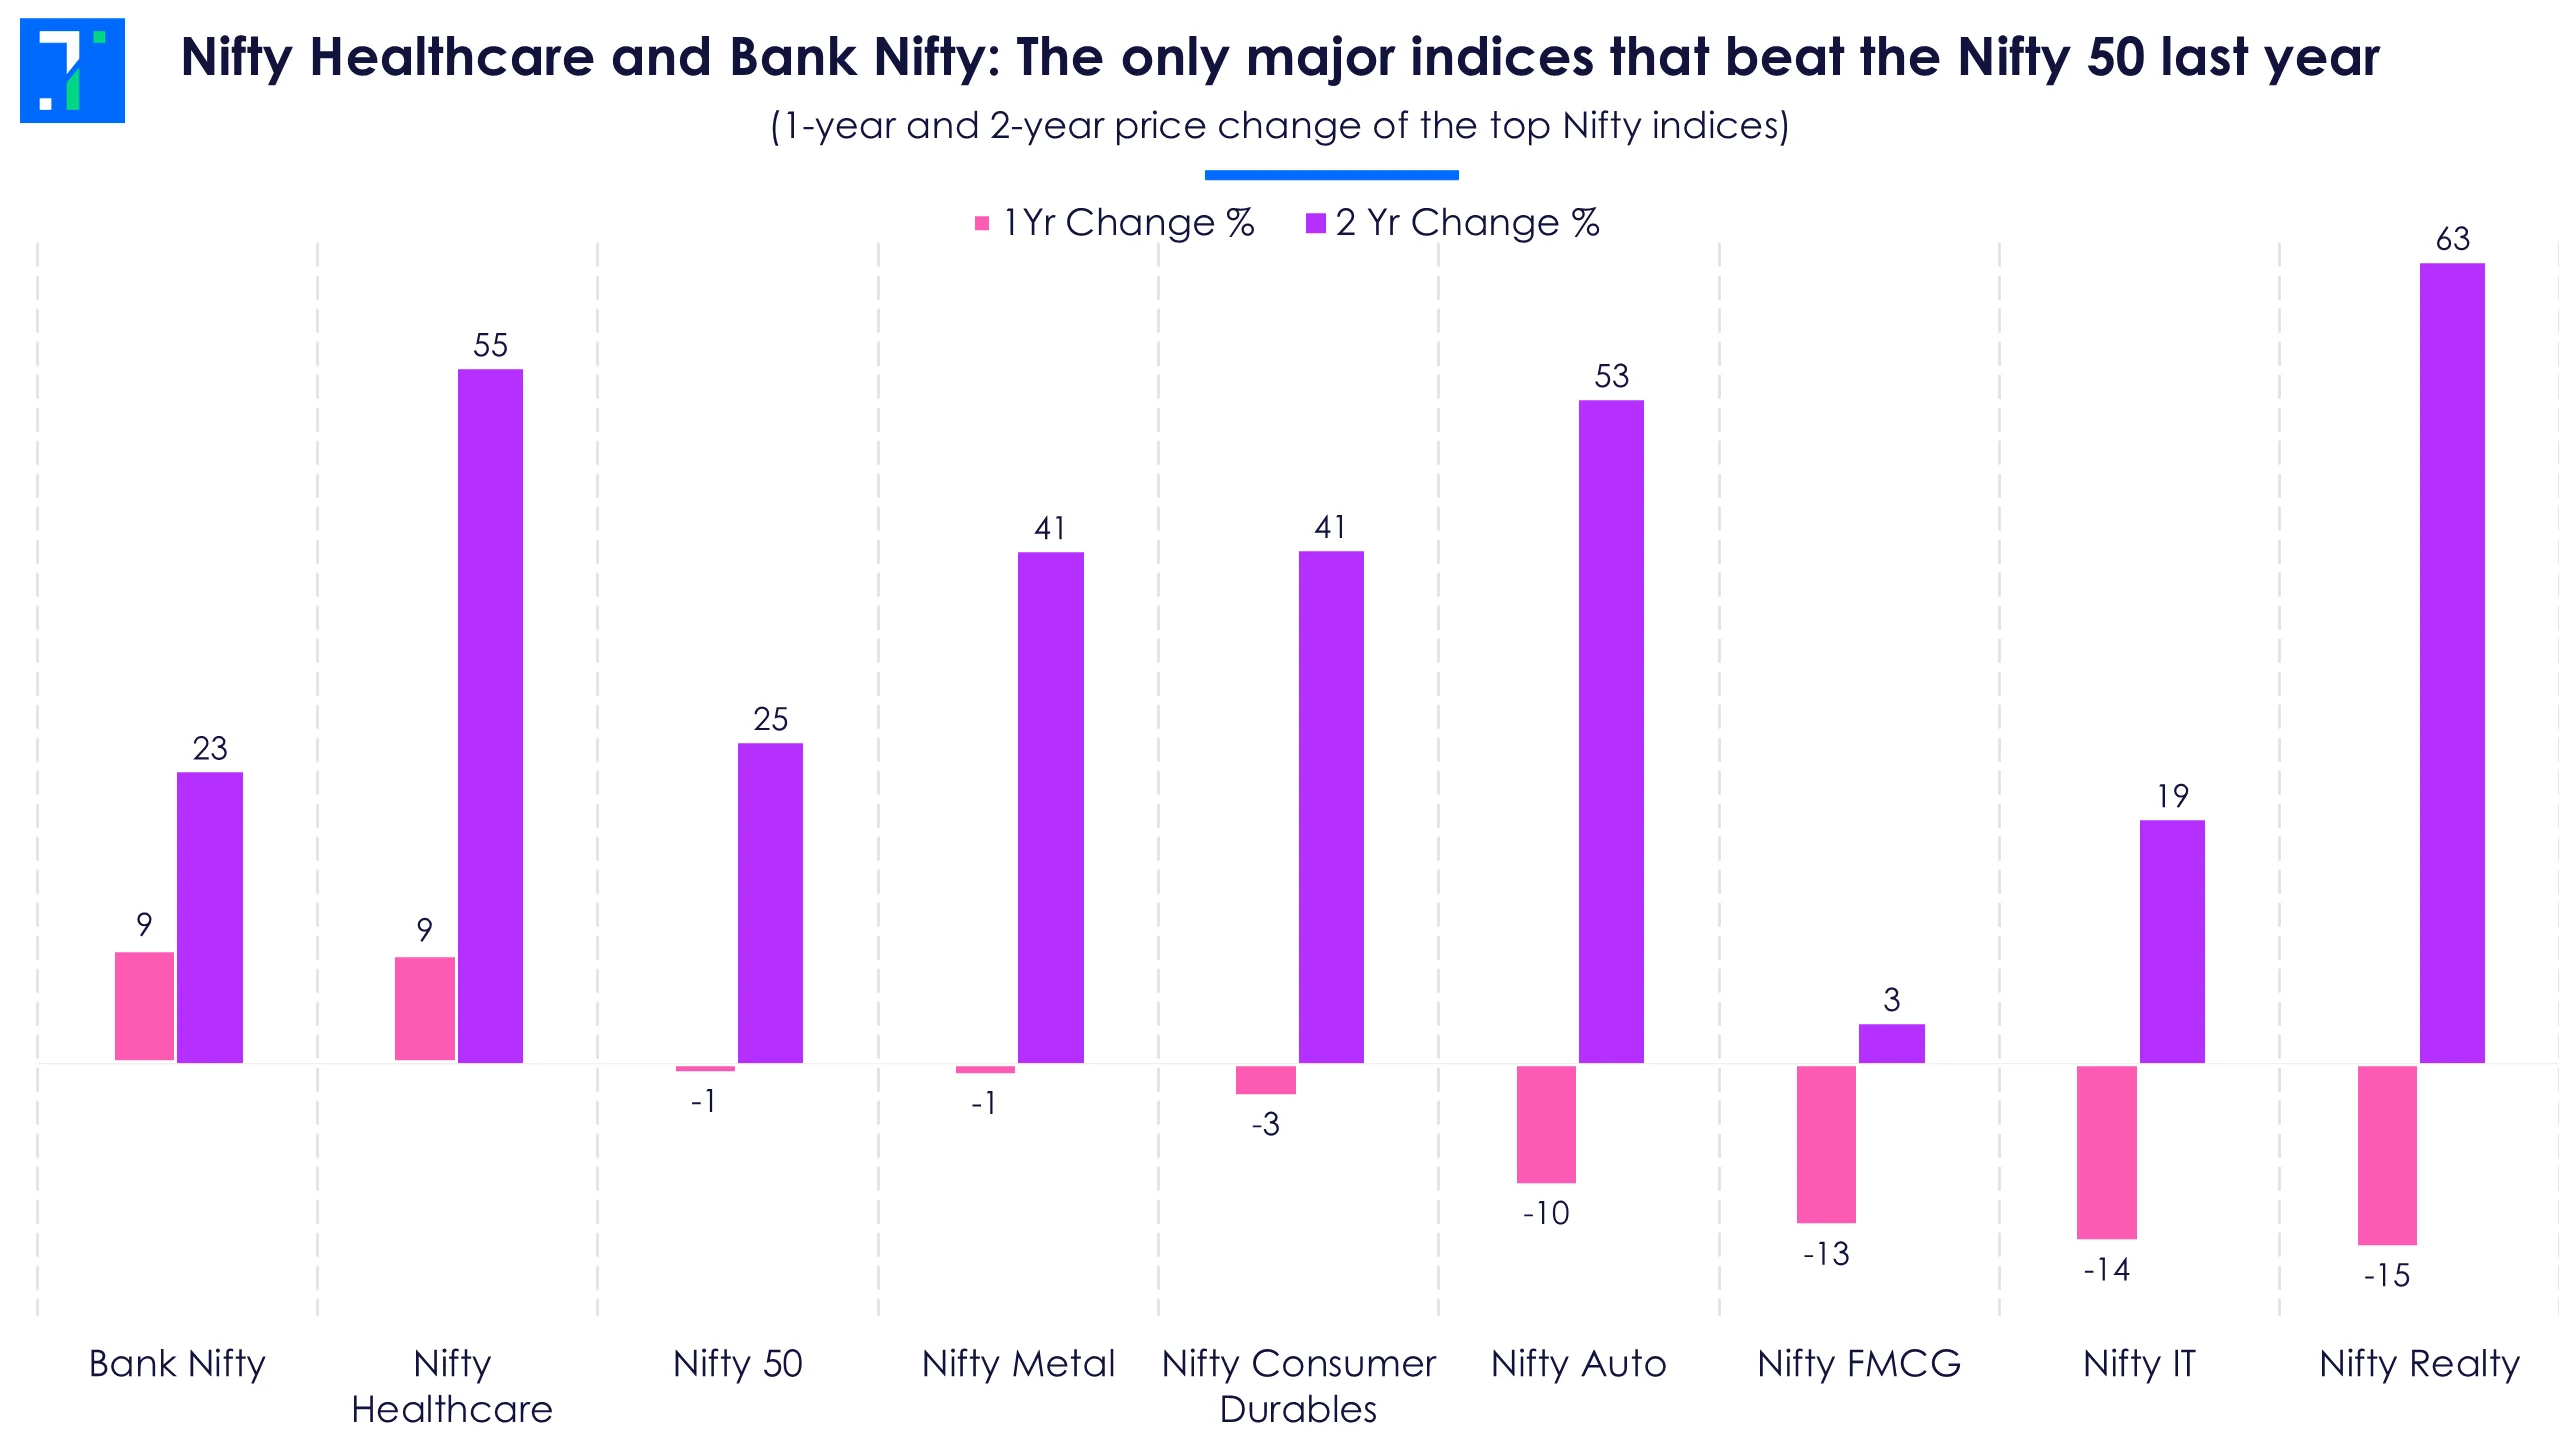
Nifty Healthcare and Bank Nifty: The only major indices that beat the Nifty 50 last year
What about valuations? Only two Nifty indices, the Bank Nifty and Nifty Metal, trade at a lower P/E ratio than the Nifty 50.
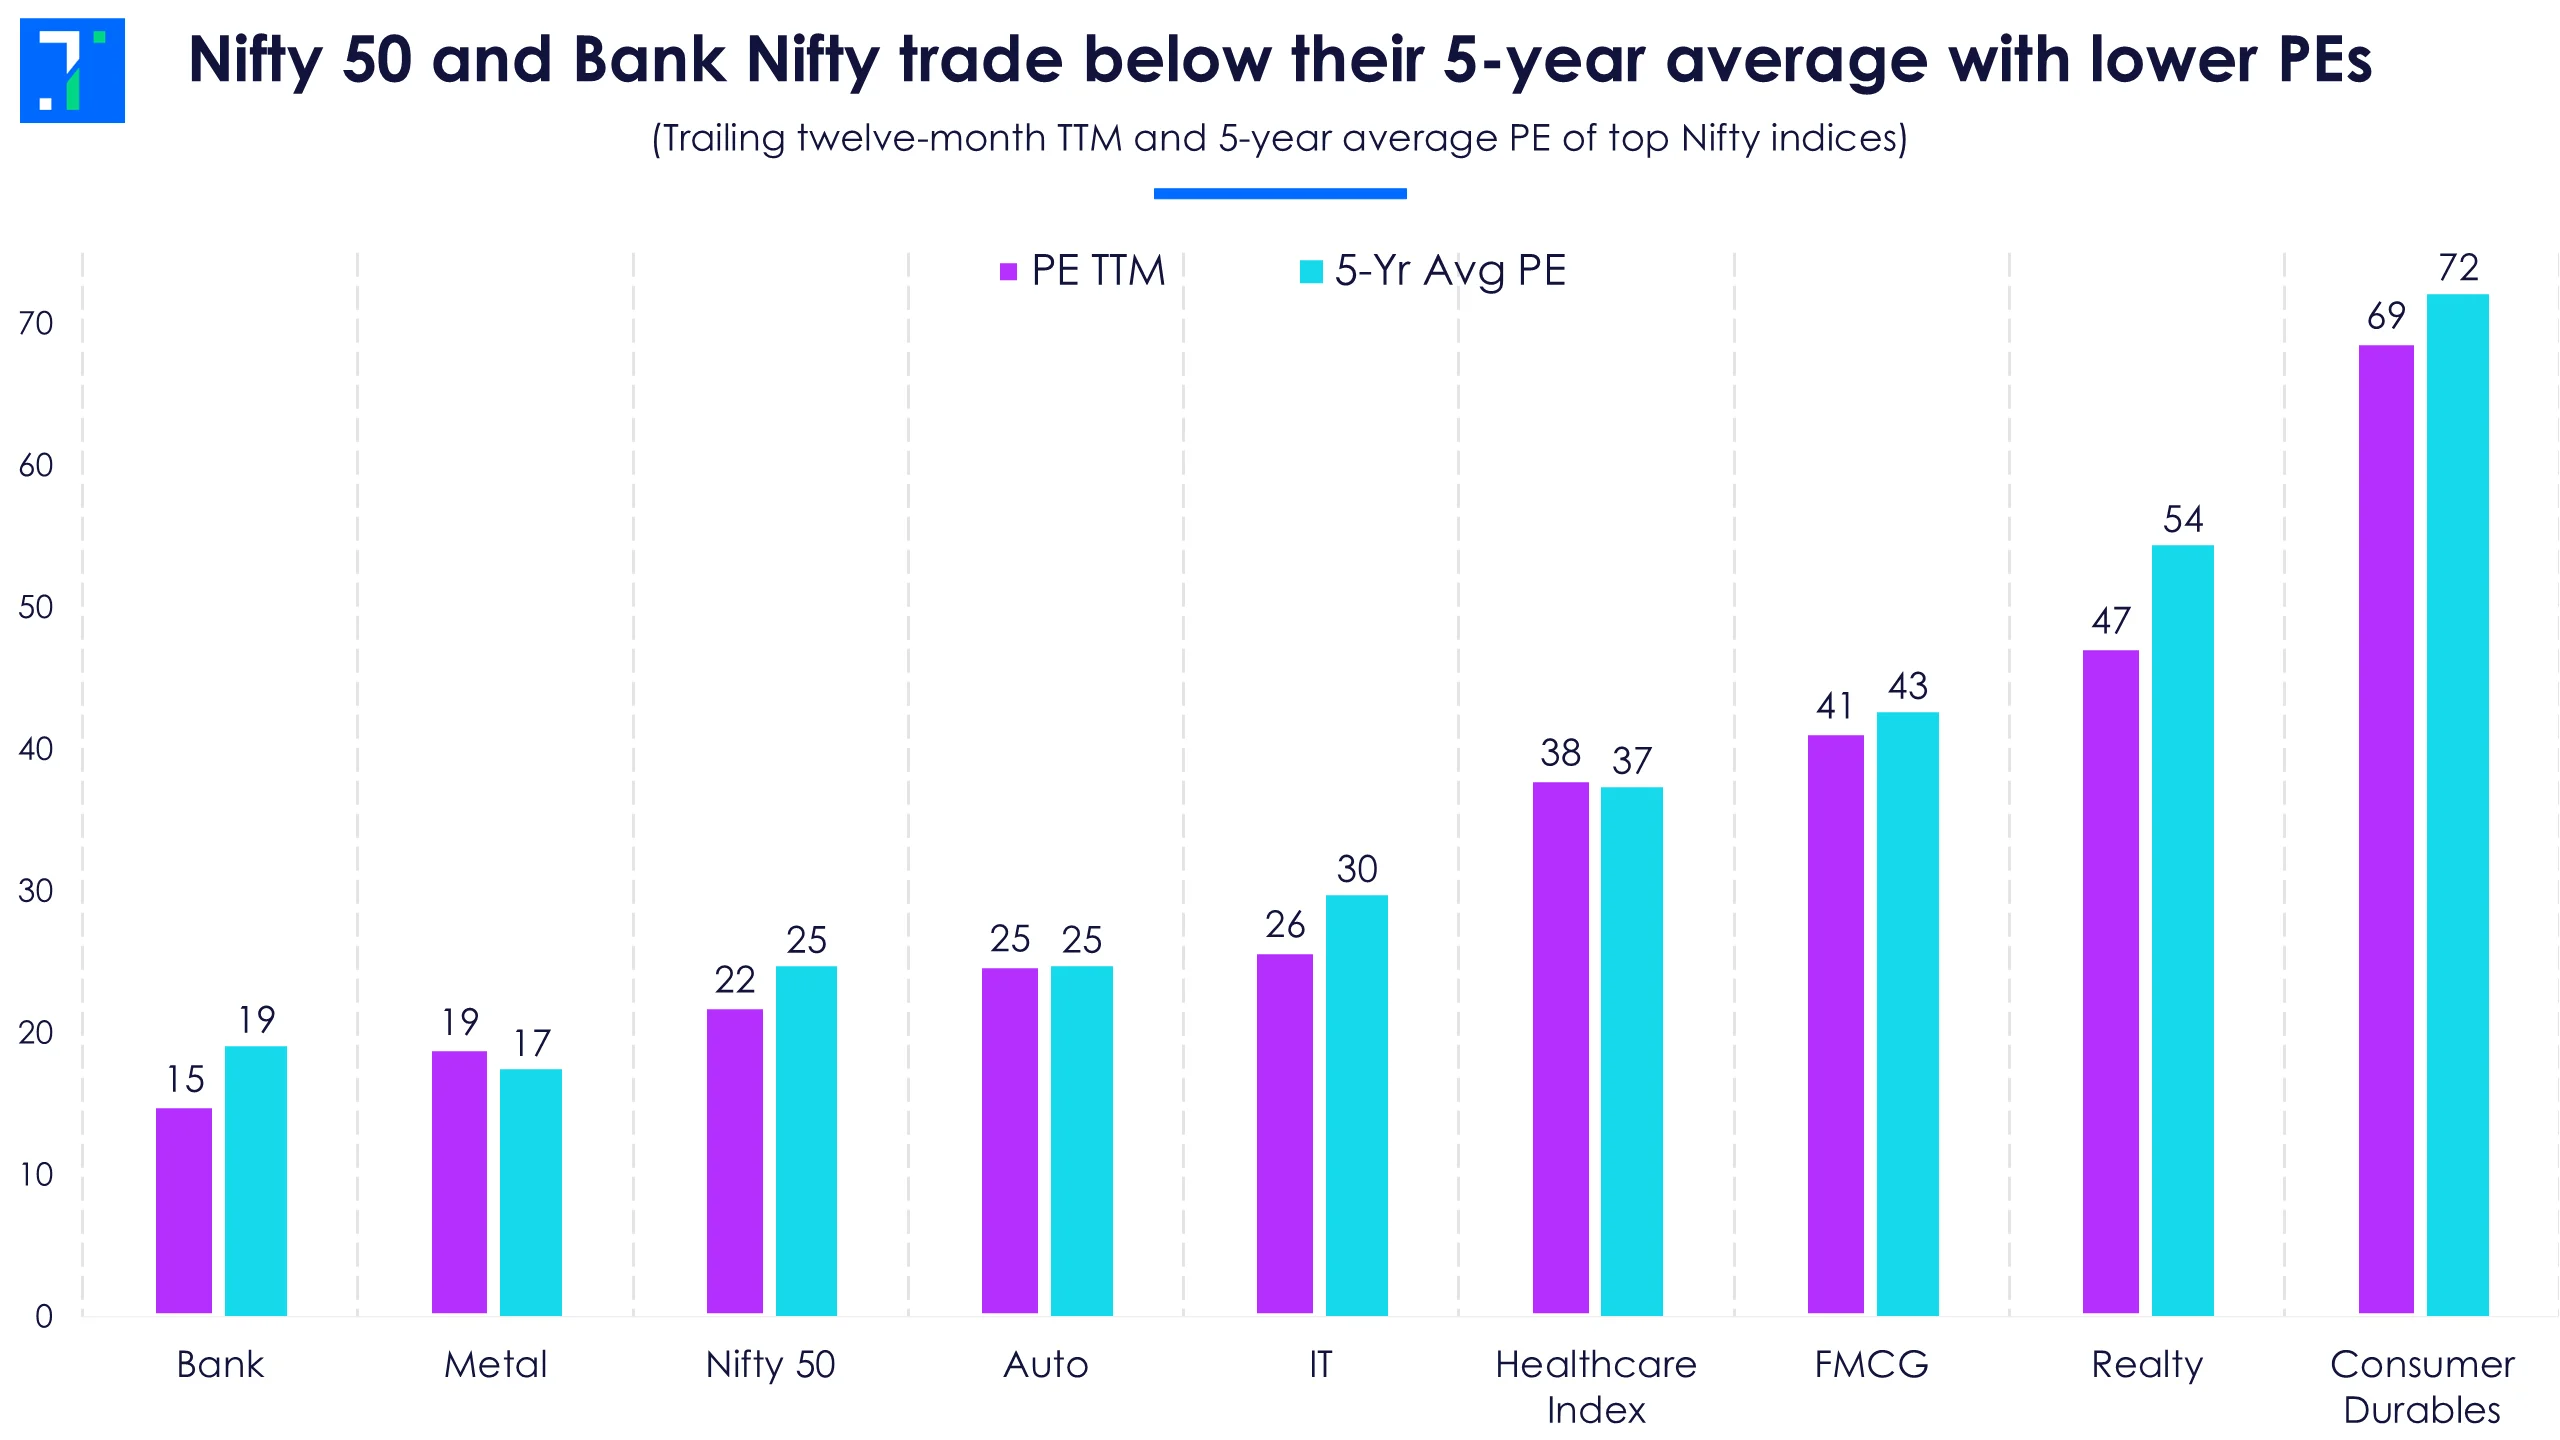
Nifty 50 and Bank Nifty trade below their 5-year average with lower PEs
Nifty Bank has the lowest PE ratio among major indices, and still ranks as the best performer over the last year.
What’s powering the market: Sector leaders and stock outperformers
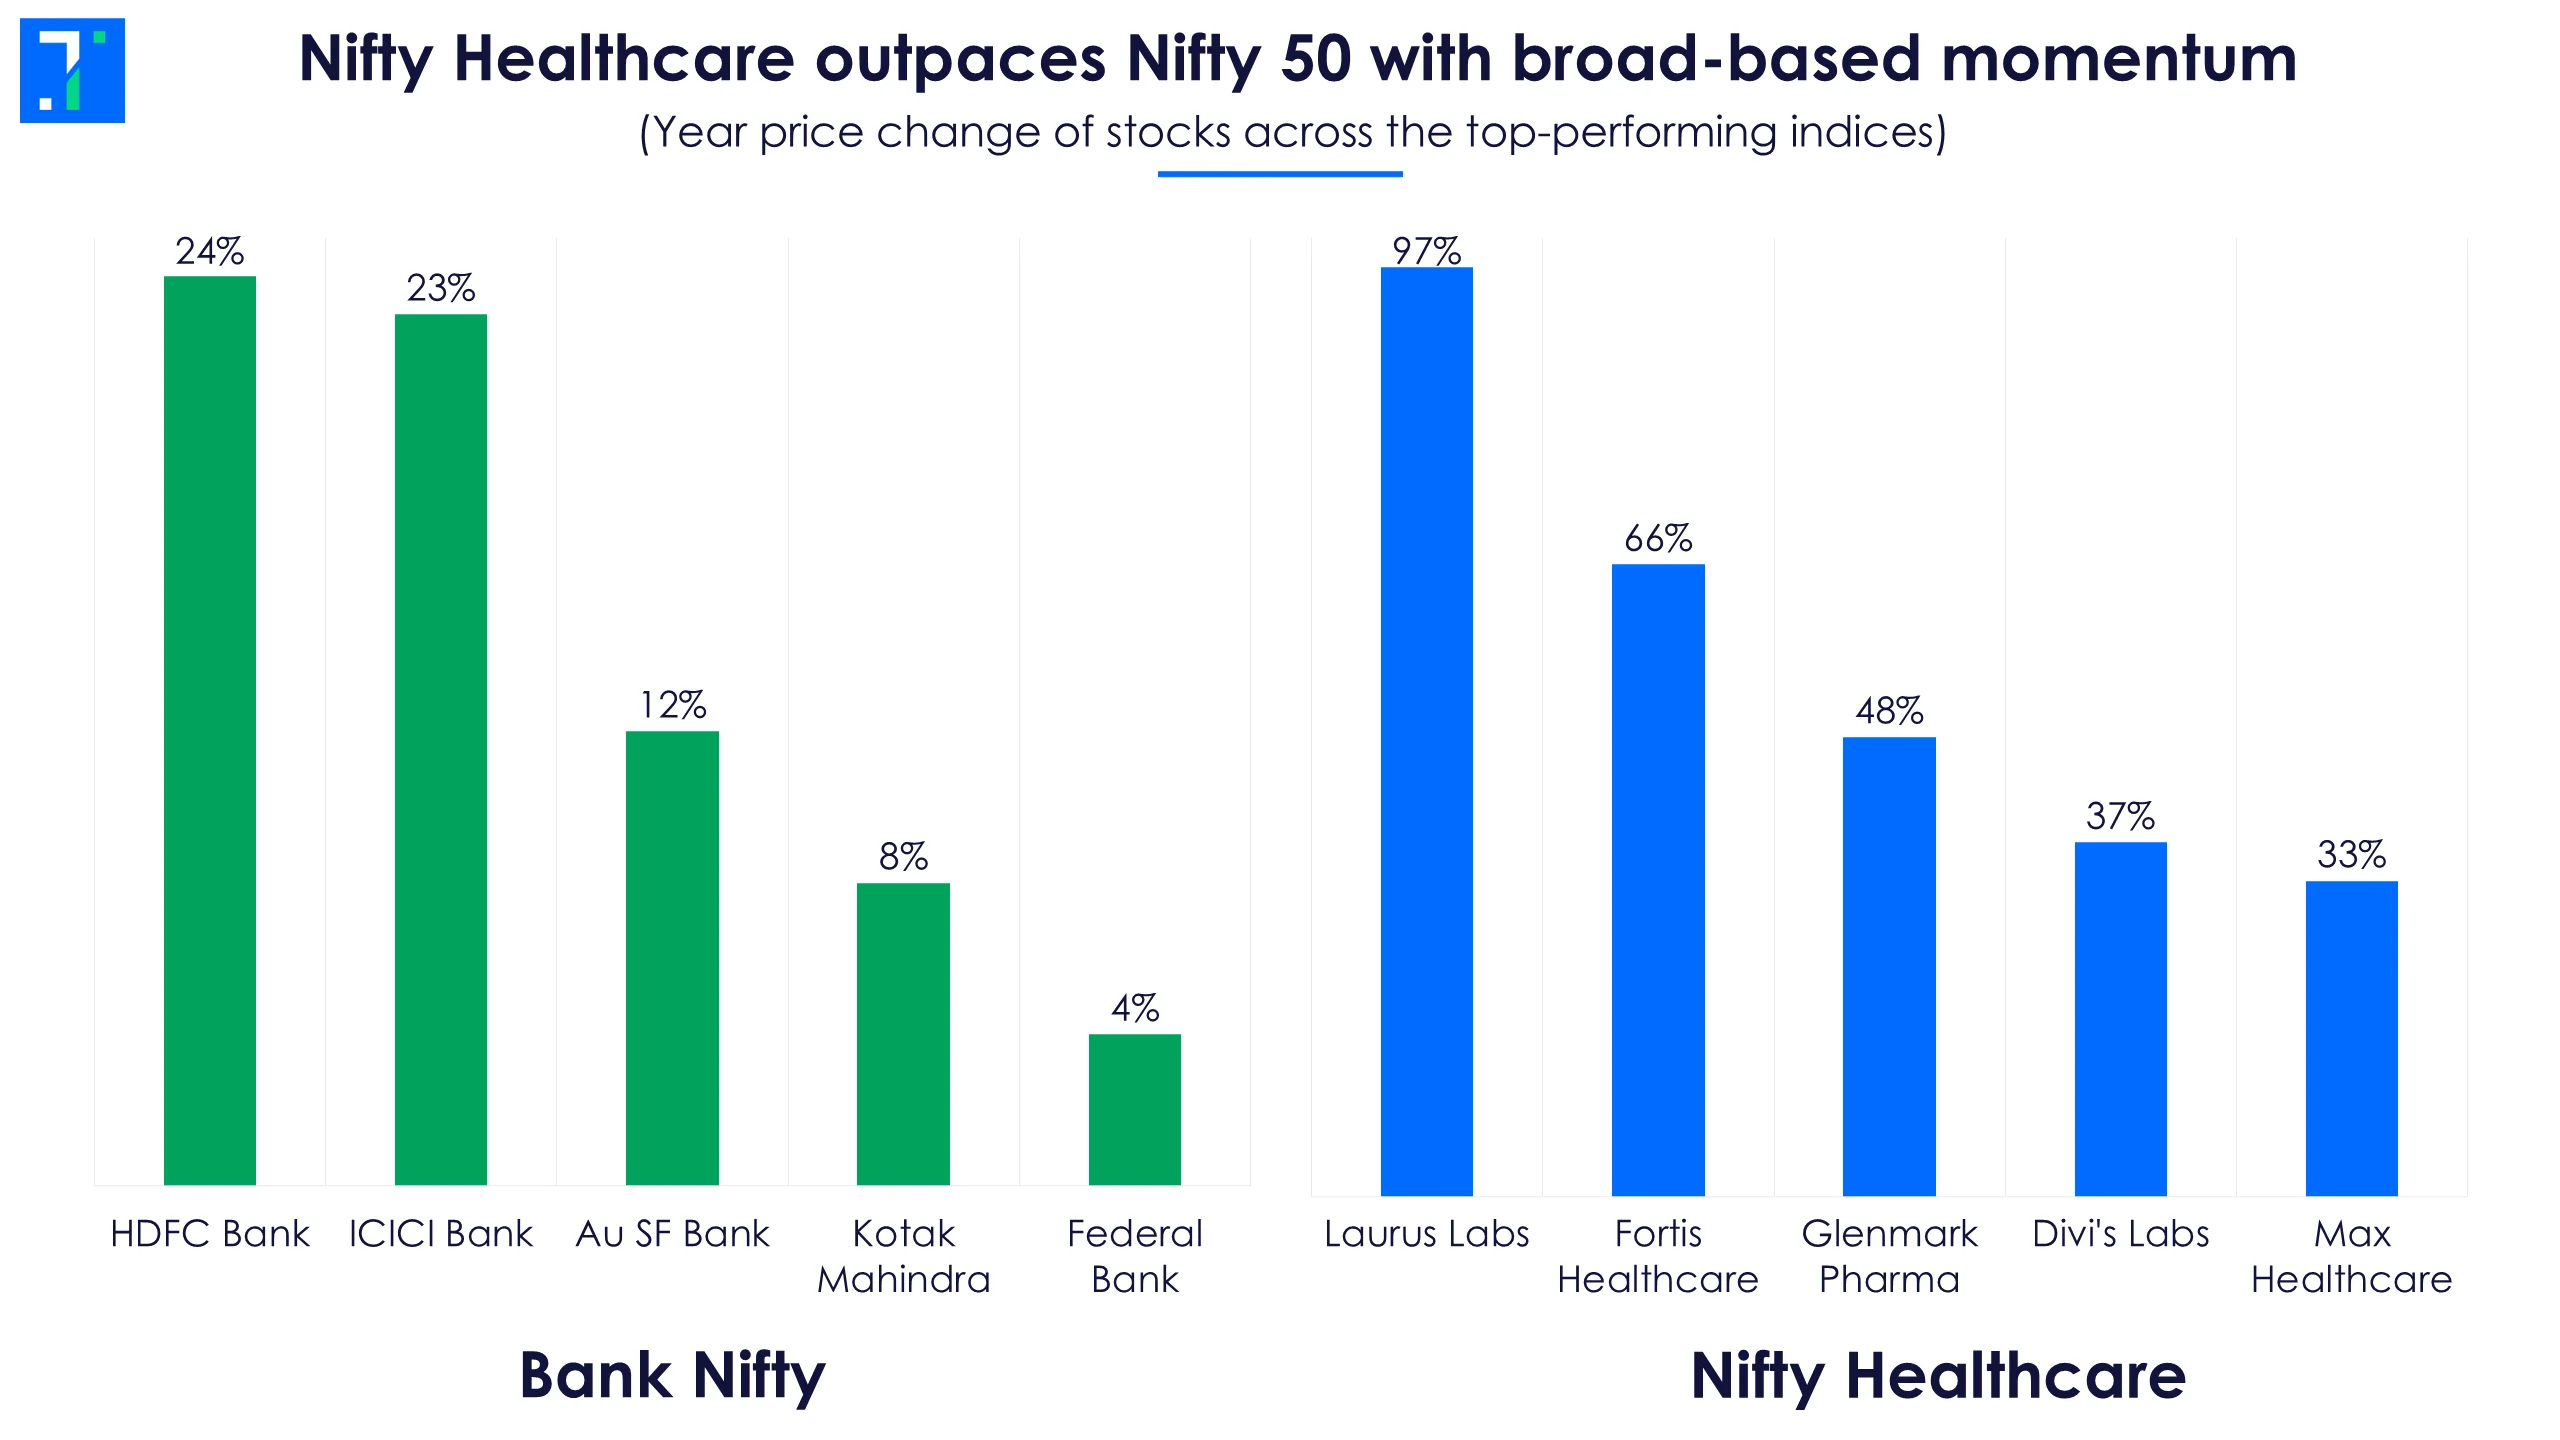
Of the two indices that outperformed the Nifty 50 in the past year, Nifty Healthcare shows broader strength, with 12 of its 20 stocks in the green.
While Bank Nifty is the top performer, it is heavily reliant on HDFC Bank’s 24% surge. Just five of its 12 constituents posted gains, with the rest dragging.
Nifty Healthcare’s momentum is driven by strong domestic pharma demand, global contract manufacturing growth, and easing US pricing pressures. Laurus Labs, Glenmark Pharma and Divi’s Labs are benefiting from these tailwinds.
Hospital stocks, such as Fortis and Max Healthcare, are also among the top performers, driven by rising patient volumes, increased bed capacity, and higher revenue per bed.
Nifty Healthcare outpaces Nifty 50 with broad-based momentum
Over the past year, banking stocks have benefited from strong net interest income, falling repo rate, low NPAs, and digital upgrades. HDFC Bank, ICICI Bank, Au Small Finance Bank, Kotak Mahindra Bank, and Federal Bank are the top-performing stocks in the Bank Nifty over the past year. Kotak Mahindra Bank makes it to the list despite falling sharply post its weak results.
Screener: Stocks outperforming the Nifty over the past year with rising momentum scores
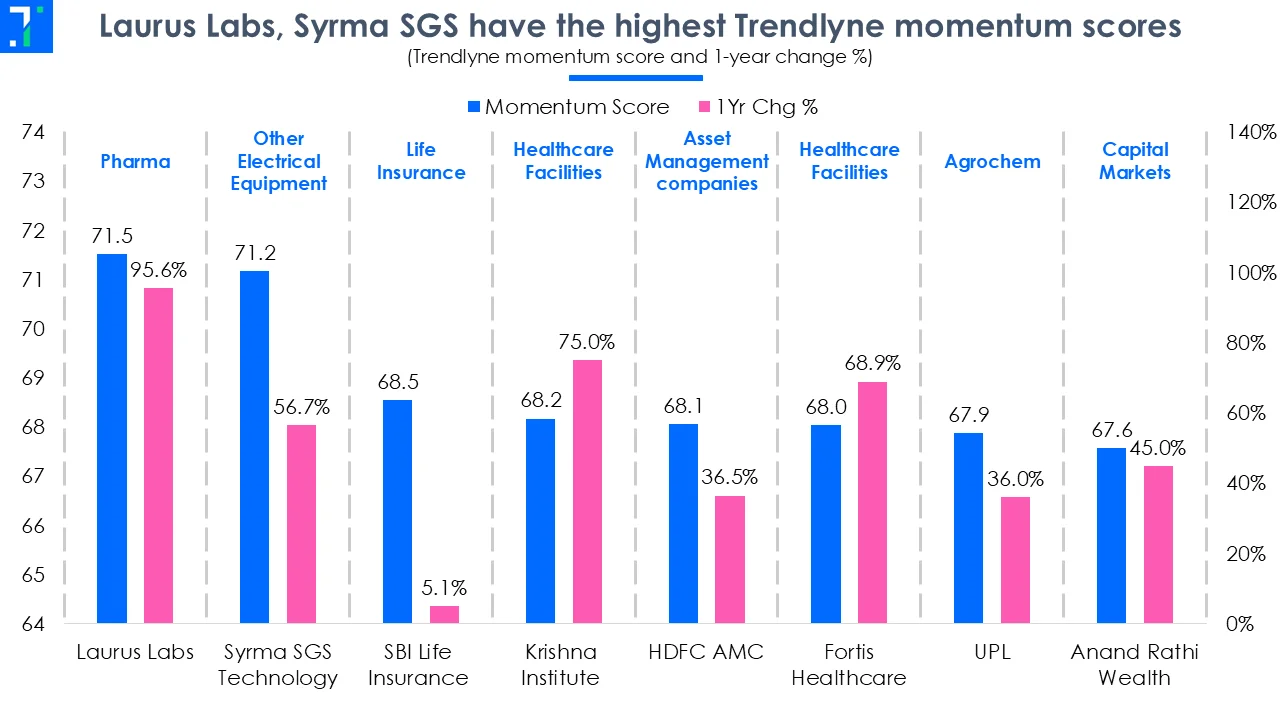
Laurus Labs, Syrma SGS have the highest Trendlyne momentum
With the Indian markets under pressure in July, we look at stocks with strong price growth, which are seeing a rise in momentum. This screener shows stocks outperforming the Nifty over the past year, and gaining over five years, with growing Trendlyne momentum scores.
The screener is dominated by stocks from the pharmaceuticals, healthcare facilities, asset management, housing finance, iron & steel products, and capital markets industries. Major stocks in the screener are Laurus Labs, Syrma SGS Technology, SBI Life Insurance, Krishna Institute of Medical Sciences, HDFC Asset Management, Fortis Healthcare, UPL, and Anand Rath Wealth.
Syrma SGS Technologies has the highest Trendlyne momentum score of 70.8, with the stock rising 56.9% over the past month. This electrical equipment company’s Q1FY26 net profit surged 157.8% YoY, beating Forecaster estimates by 28.5%. An improvement in product mix, driven by reduced contribution from the lower margin consumer segment (34% of revenue vs 53% in Q1FY25) and increased contribution from the higher margin automotive and industrial segments, helped net profit to grow.
However, its revenue declined 18.3% YoY due to a reduction in the consumer and railways segments. But this is in line with the management’s aim to reduce the consumer segment’s contribution to 30% of revenue in FY26.
Laurus Labs also shows up in the screener with a Trendlyne momentum score of 69.5. This pharma stock surged 102.6% over the past year. The company’s momentum increased after its Q1FY26 net profit and revenue jumped 13x and 32% YoY, beating Forecaster estimates by 55.1% and 8.2%, respectively. Its revenue growth outpaced the rise in expenses, helping improve profitability. On the other hand, improvements across the contract development & manufacturing organisation (CDMO) and generics businesses drove revenue growth.
You can find some popular screeners here.
