

IPOs are having a moment. Twelve mainboard IPOs have listed in August so far, and all of them drew plenty of investor interest and strong listing gains. The appetite for stocks hasn’t disappeared.
But you wouldn’t know it by looking at the Nifty 50.
The index has not moved much over the past month, quarter, or even the past two years. This is despite India Inc delivering impressive revenue growth this June quarter - the fastest in 15 quarters. Higher oil prices have pushed up costs across industries, but earnings momentum is positive.
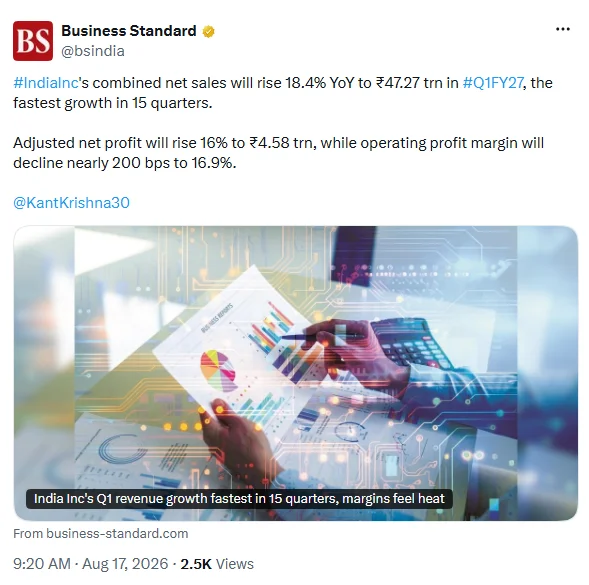
Kuunal Shah, fund manager at Carnelian Asset Management & Advisors, says, “Earnings growth in India has improved over the last three quarters, and that should continue.” He expects earnings growth of 14%-15% for Nifty 500 companies in 2027 and 2028.
So, if earnings have picked up and investors are still buying stocks, why is the Nifty 50 going nowhere?
Let’s dive in.

The Nifty 50 stayed flat, even as the rest of the market was moving
One major culprit is driving the headlines of a muted stock market: India’s benchmark index, the Nifty 50.
The Nifty 50's weekly average volume of 26.7 crore shares is more than a third below its 6-month average of 42 crore. This is a significant cooldown in largecap trading activity. The Nifty stayed flat in returns over the past year, while mid and small caps rose by double digits and hit new highs.
Selling by foreign investors, while domestic investors favoured mid and small-caps, and weak performance from the biggest stocks drove this gap.
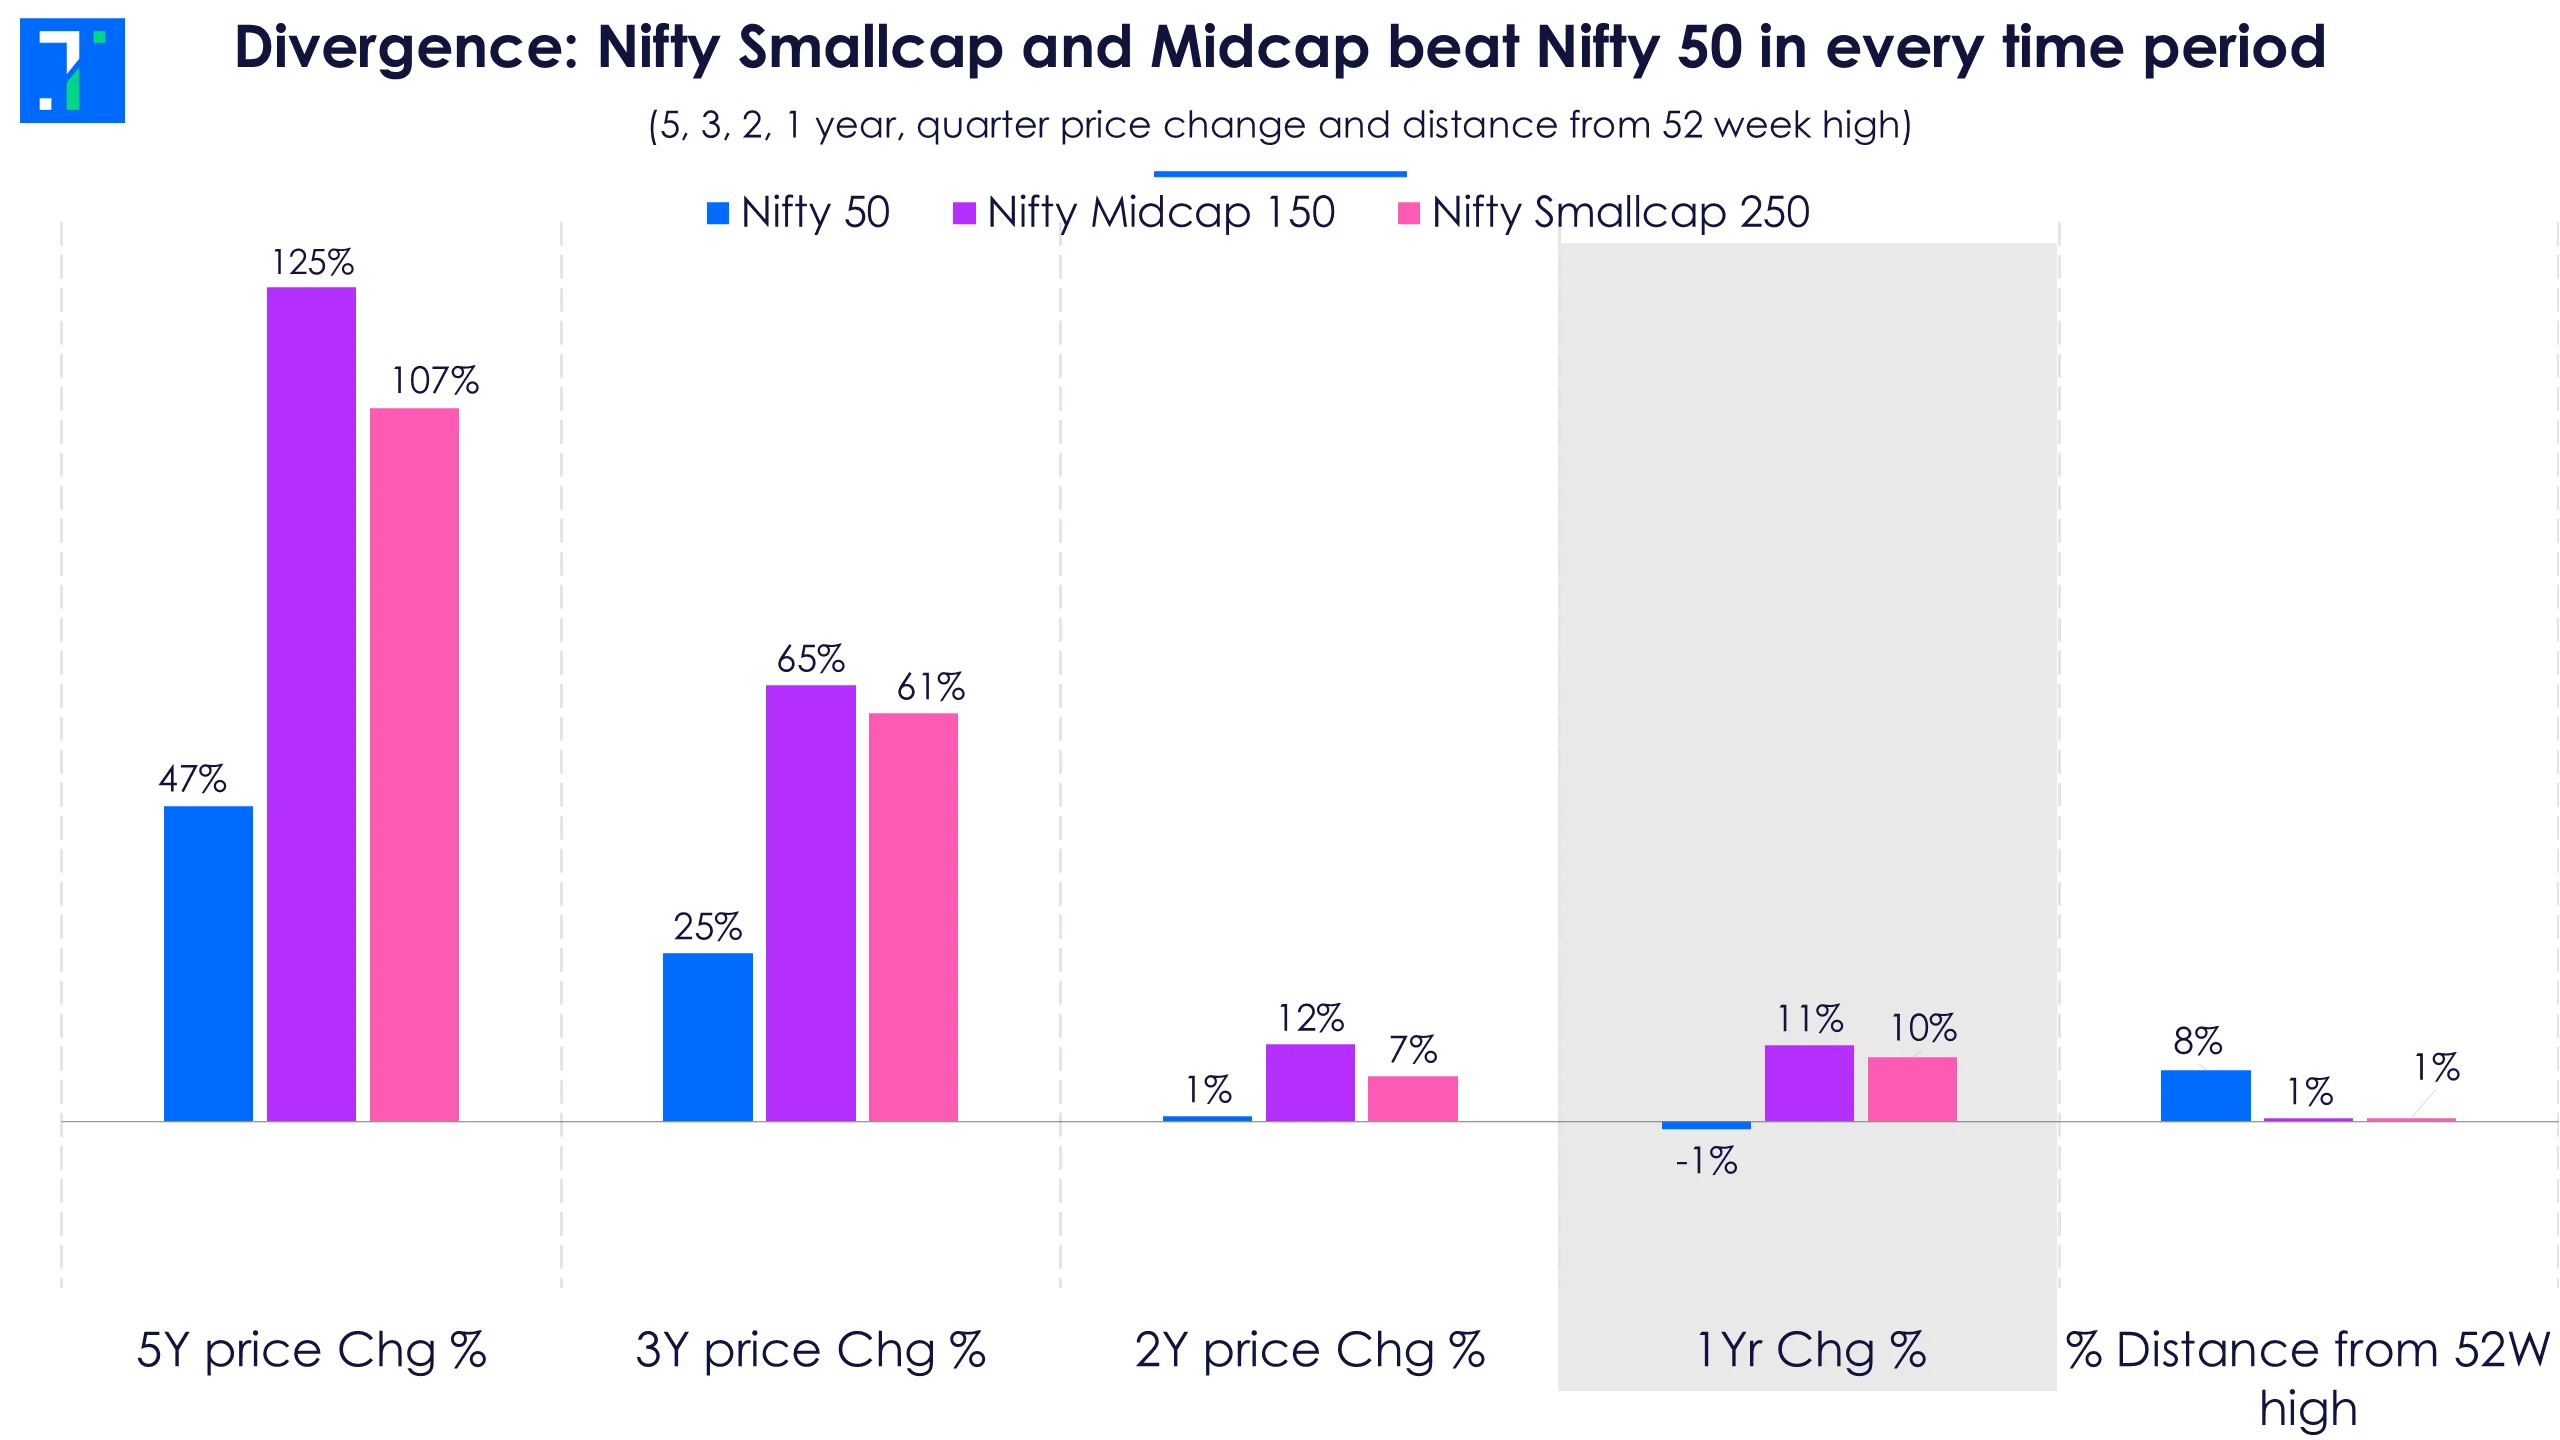
The divergence is clear over longer time frames as well.
Largecap stocks have an FII money problem
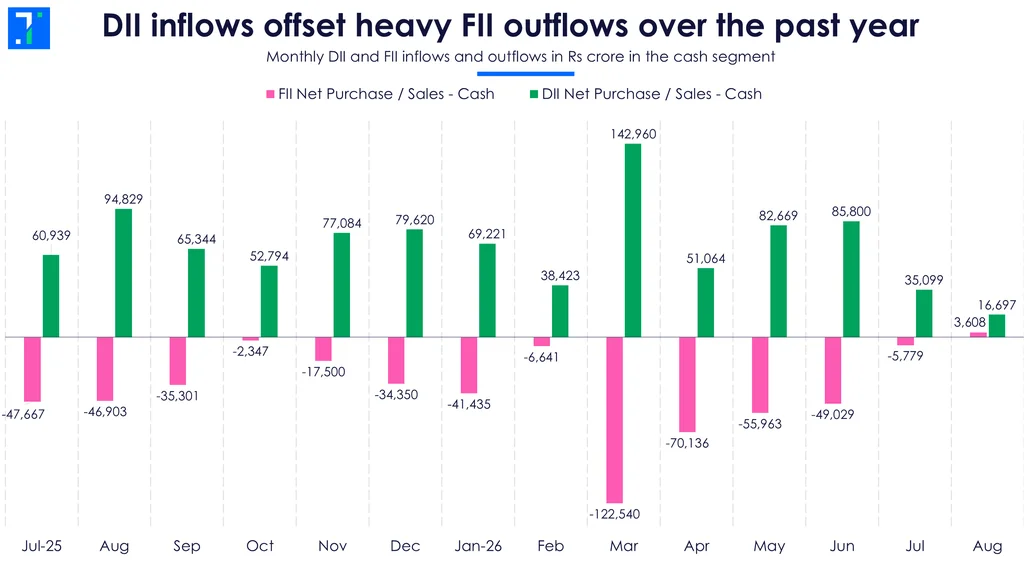
Foreign investors have been pulling money out of Indian equities, but domestic investors stepped in.
Trendlyne’s FII/DII dashboard shows FIIs sold Rs 4.9 lakh crore in the cash market over the past year, while DIIs bought Rs 8.8 lakh crore (nearly 1.8× the amount FIIs sold).
Ramesh Mantri, CIO of WhiteOak Capital, says, “Sustained FII selling has hurt largecaps disproportionately because foreign investors typically have a higher allocation to these companies.”
Where did the domestic money go?
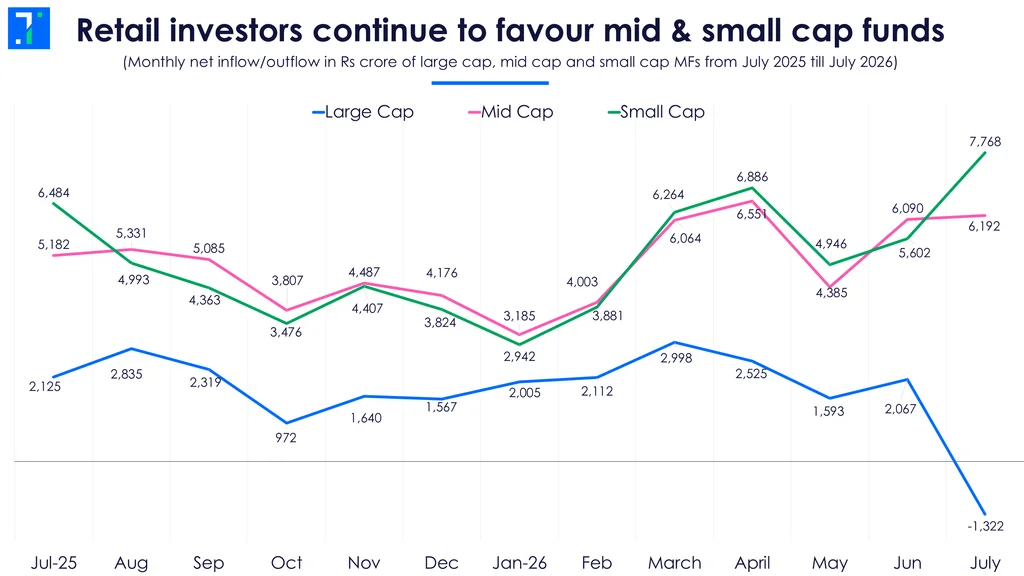
Mid and small caps are obvious favourites. Midcap and smallcap funds attracted roughly Rs 5 for every Rs 1 that went into largecap funds. Largecap funds even saw an outflow in July, their first in nearly three years.
Dinshaw Irani, CEO, Helios Capital Asset Management says, "Divergence in earnings is also making small-caps and mid-caps more attractive to investors, despite their higher risk."
Note that DII flows include MFs, insurance, EPFO and pension money. So pure fund category flows better capture active investor preference.
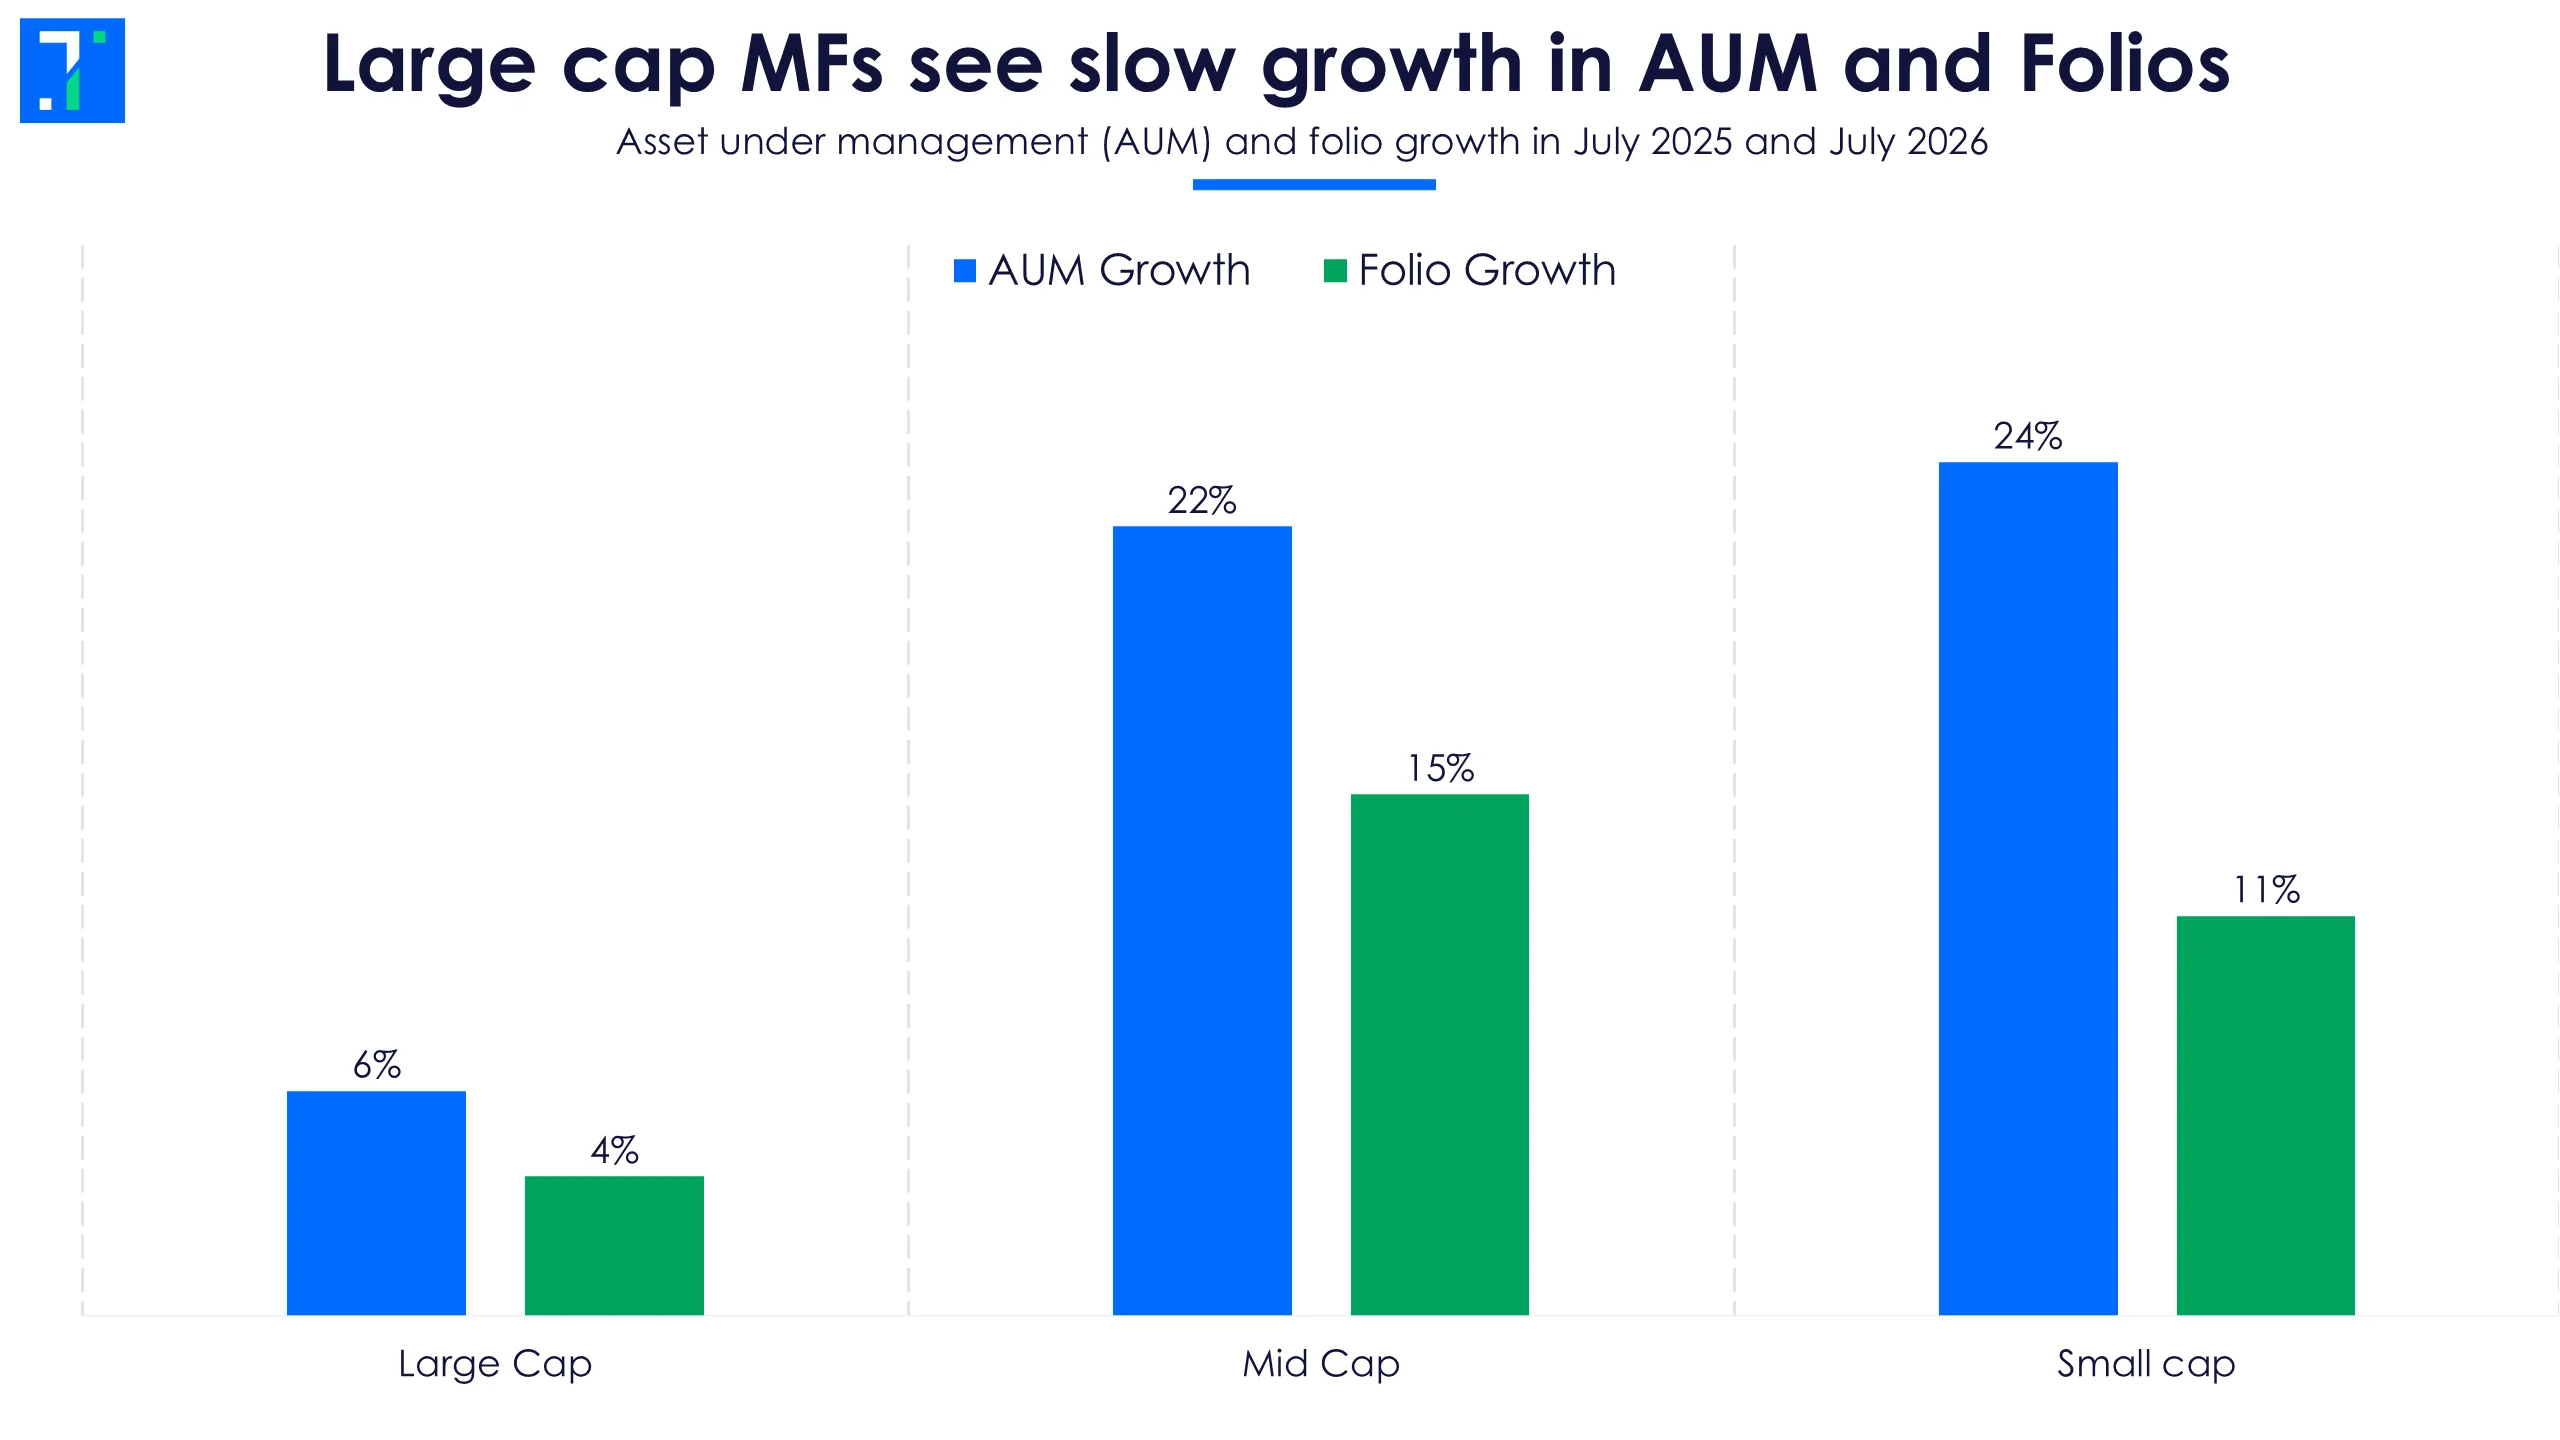
The preference for mid and small caps also shows up in AUM. Over the past year, large-cap fund AUM grew just 6%, compared with 22% for midcaps and 24% for smallcaps.
Folio growth, which is another indicator of investor participation, favoured mid and small caps.
Returns are also better for mid and small cap MFs.
Trendlyne’s Mutual Fund Dashboard shows that over the past year, midcap and smallcap MF categories gained 12% and 15%, respectively, compared with just 3% for largecap funds. But domestic institutions continued to buy large companies.
Returns explain the difference in enthusiasm
The Nifty 50’s biggest stocks struggled over the past year. HDFC Bank fell 27%, and none of the index’s top five stocks gained in double digits.
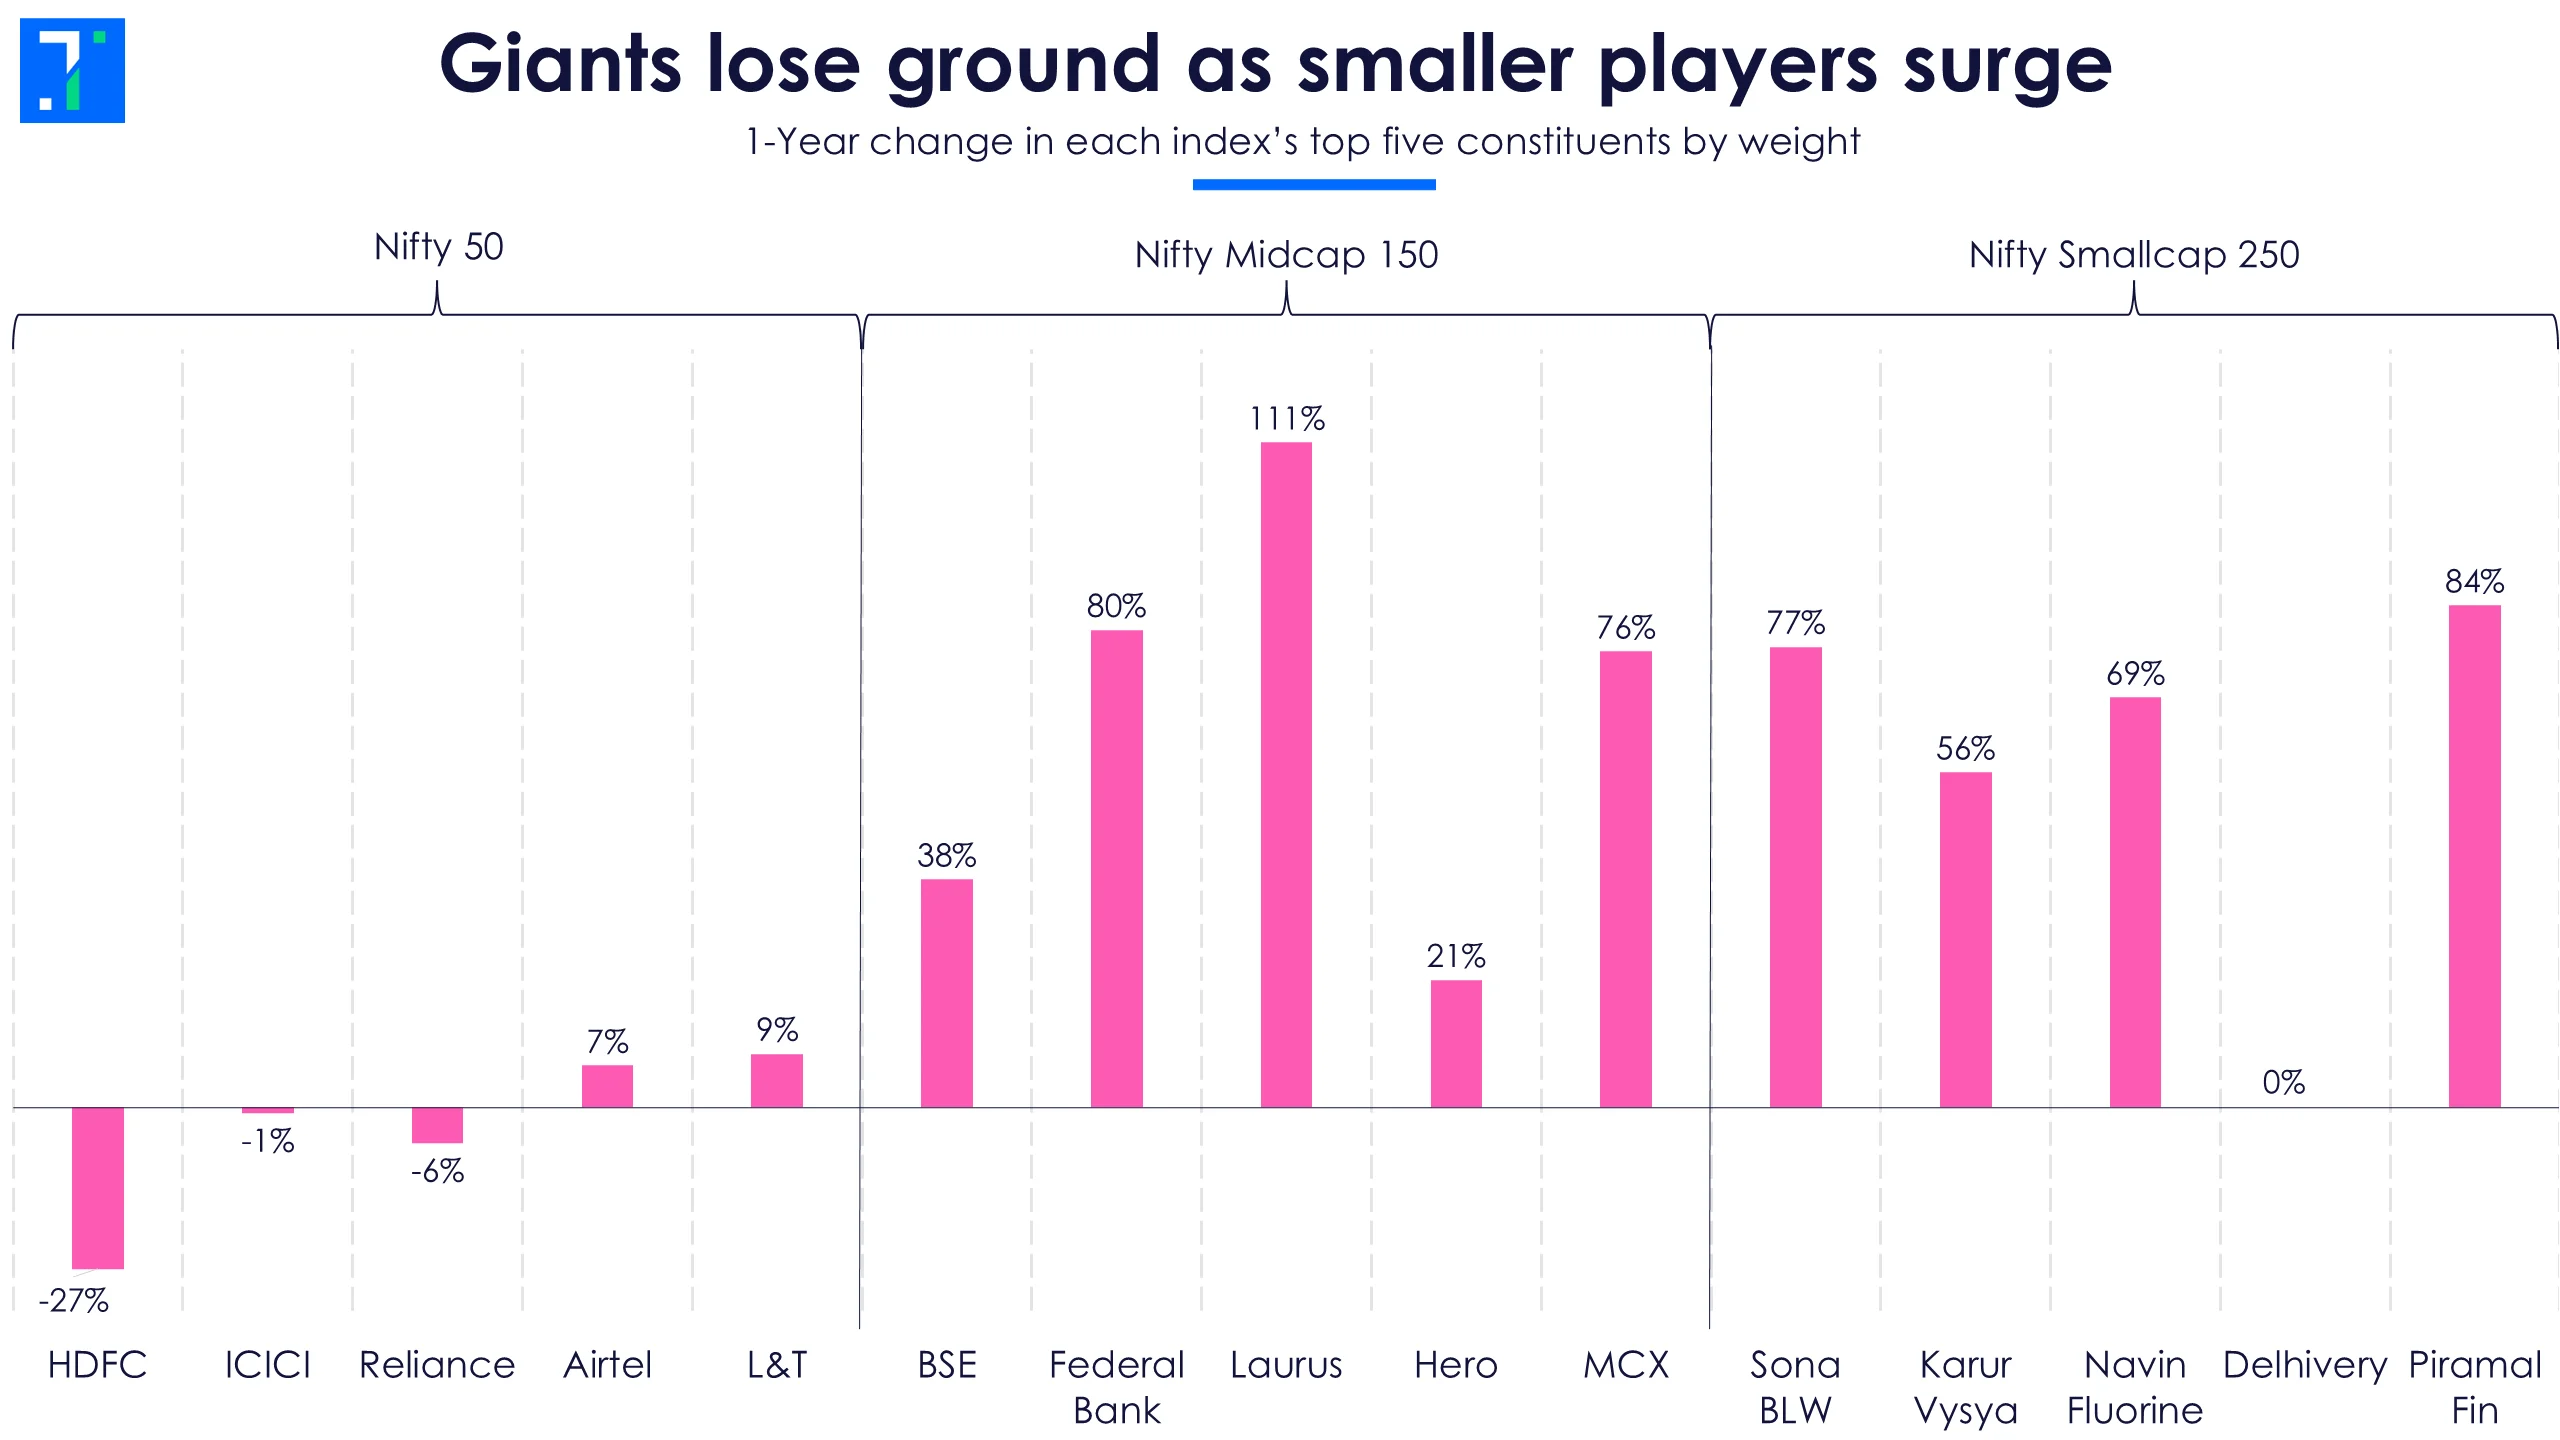
Midcaps moved in the opposite direction. All five of their biggest stocks gained in double digits, with Laurus Labs more than doubling. Smallcaps also performed well, with Delhivery the only one to remain flat.
The concentration of the Nifty 50 makes this divergence more significant. As per the latest NSE indices fact sheets, Nifty 50’s top five stocks make up around 35% of the index, compared with just around 10% for the Midcap 150 and less than 7% for the Smallcap 250. So when a few heavyweights struggle, they can drag the entire index down.
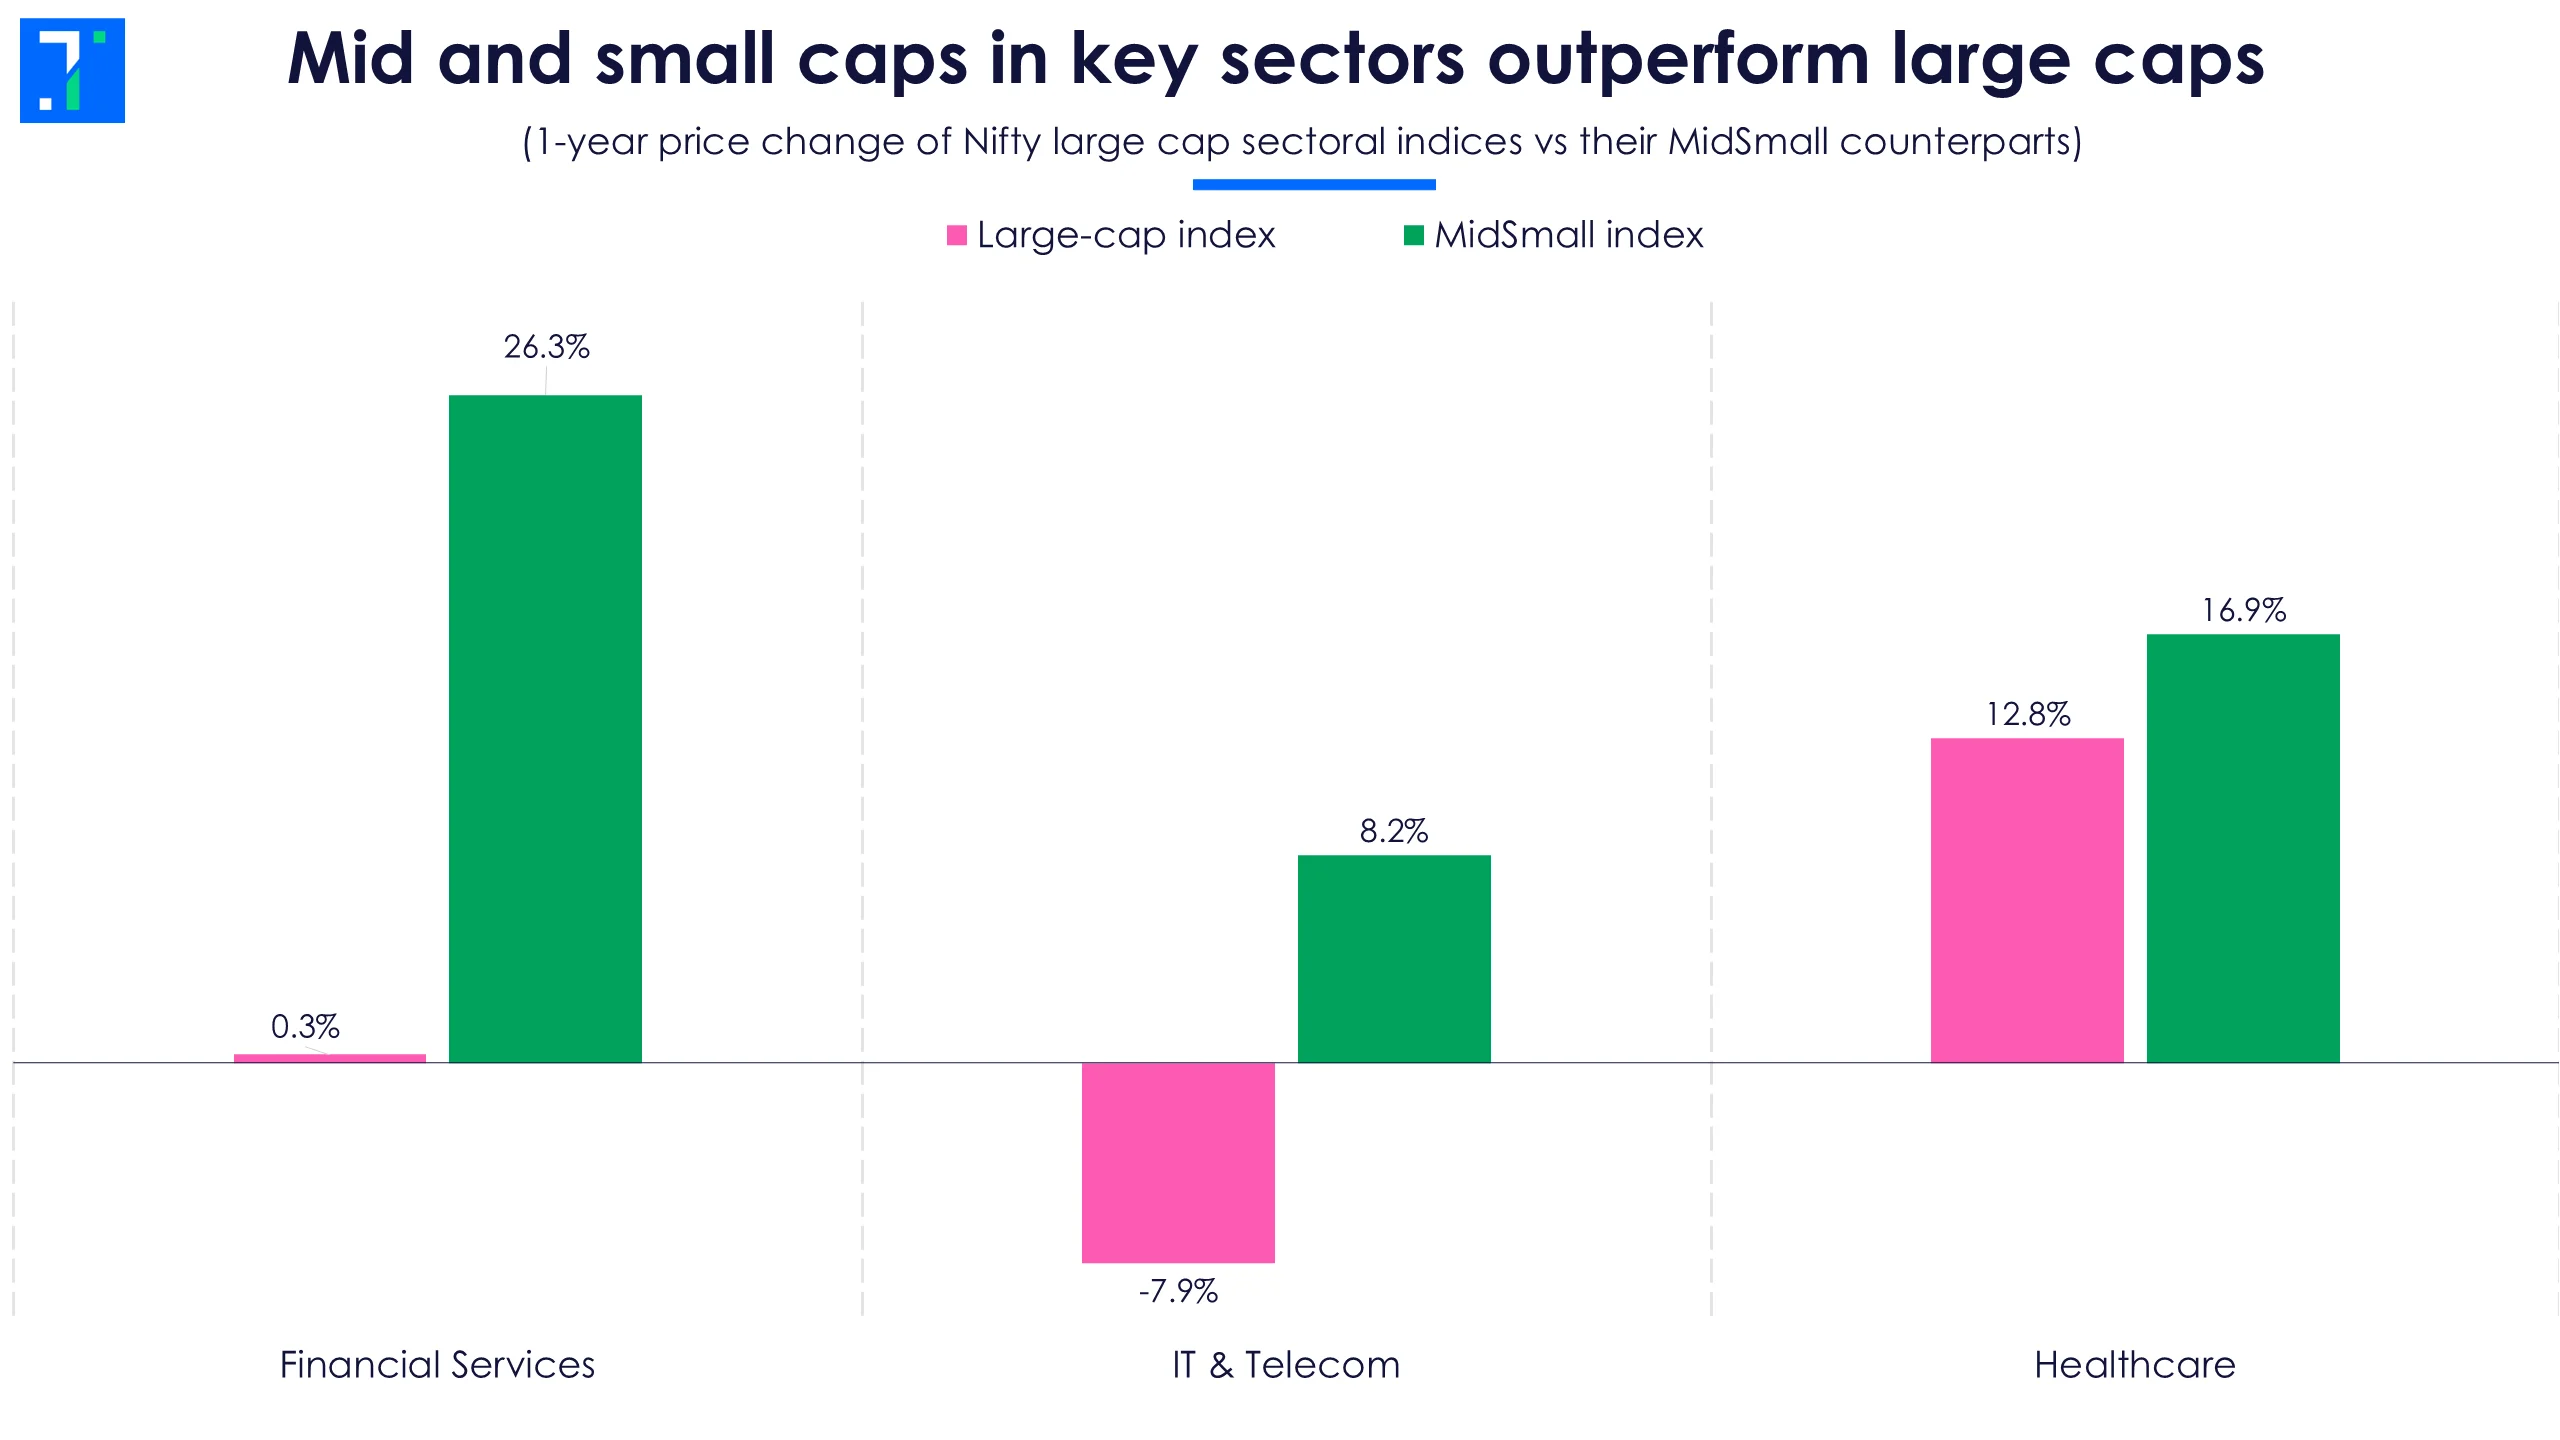
The difference is visible at the sector level too. Financial Services rose just 0.3% in the large-cap index, while the mid and small-cap index gained 26.3%. IT shows a similar split: large caps fell 7.9%, while mid and small caps rose 8.2%.
Part of the reason is the pressure on large IT companies, as clients have become more cautious about traditional outsourcing. In financials, the difference has more to do with the stocks that make up the mid and small-cap index.
IT was a major drag on large caps. TCS fell 24%, Wipro 27% and Infosys 23%, as clients became more cautious about traditional outsourcing and focused more on AI-led productivity.
Mid-sized IT firms did better. Coforge and Persistent, with their stronger engineering businesses, were among the better performers.
Financials also saw a big difference between large and mid/small caps. HDFC Bank, the biggest stock in the large-cap financials index, fell sharply and dragged the segment down.
The mid and small-cap index has more non-lenders. BSE, MCX and PB Fintech make up a sizeable share, benefiting from rising activity in trading, investing and insurance. BSE rose 32% and MCX 84%.
Where does that leave the Nifty 50?
It’s not all bad news. The index has recovered some ground over the past quarter, helped by a rebound in IT. And after its underperformance, valuations have become more attractive: the Nifty 50 is now trading below its 1-year, 2-year and 5-year average PE.
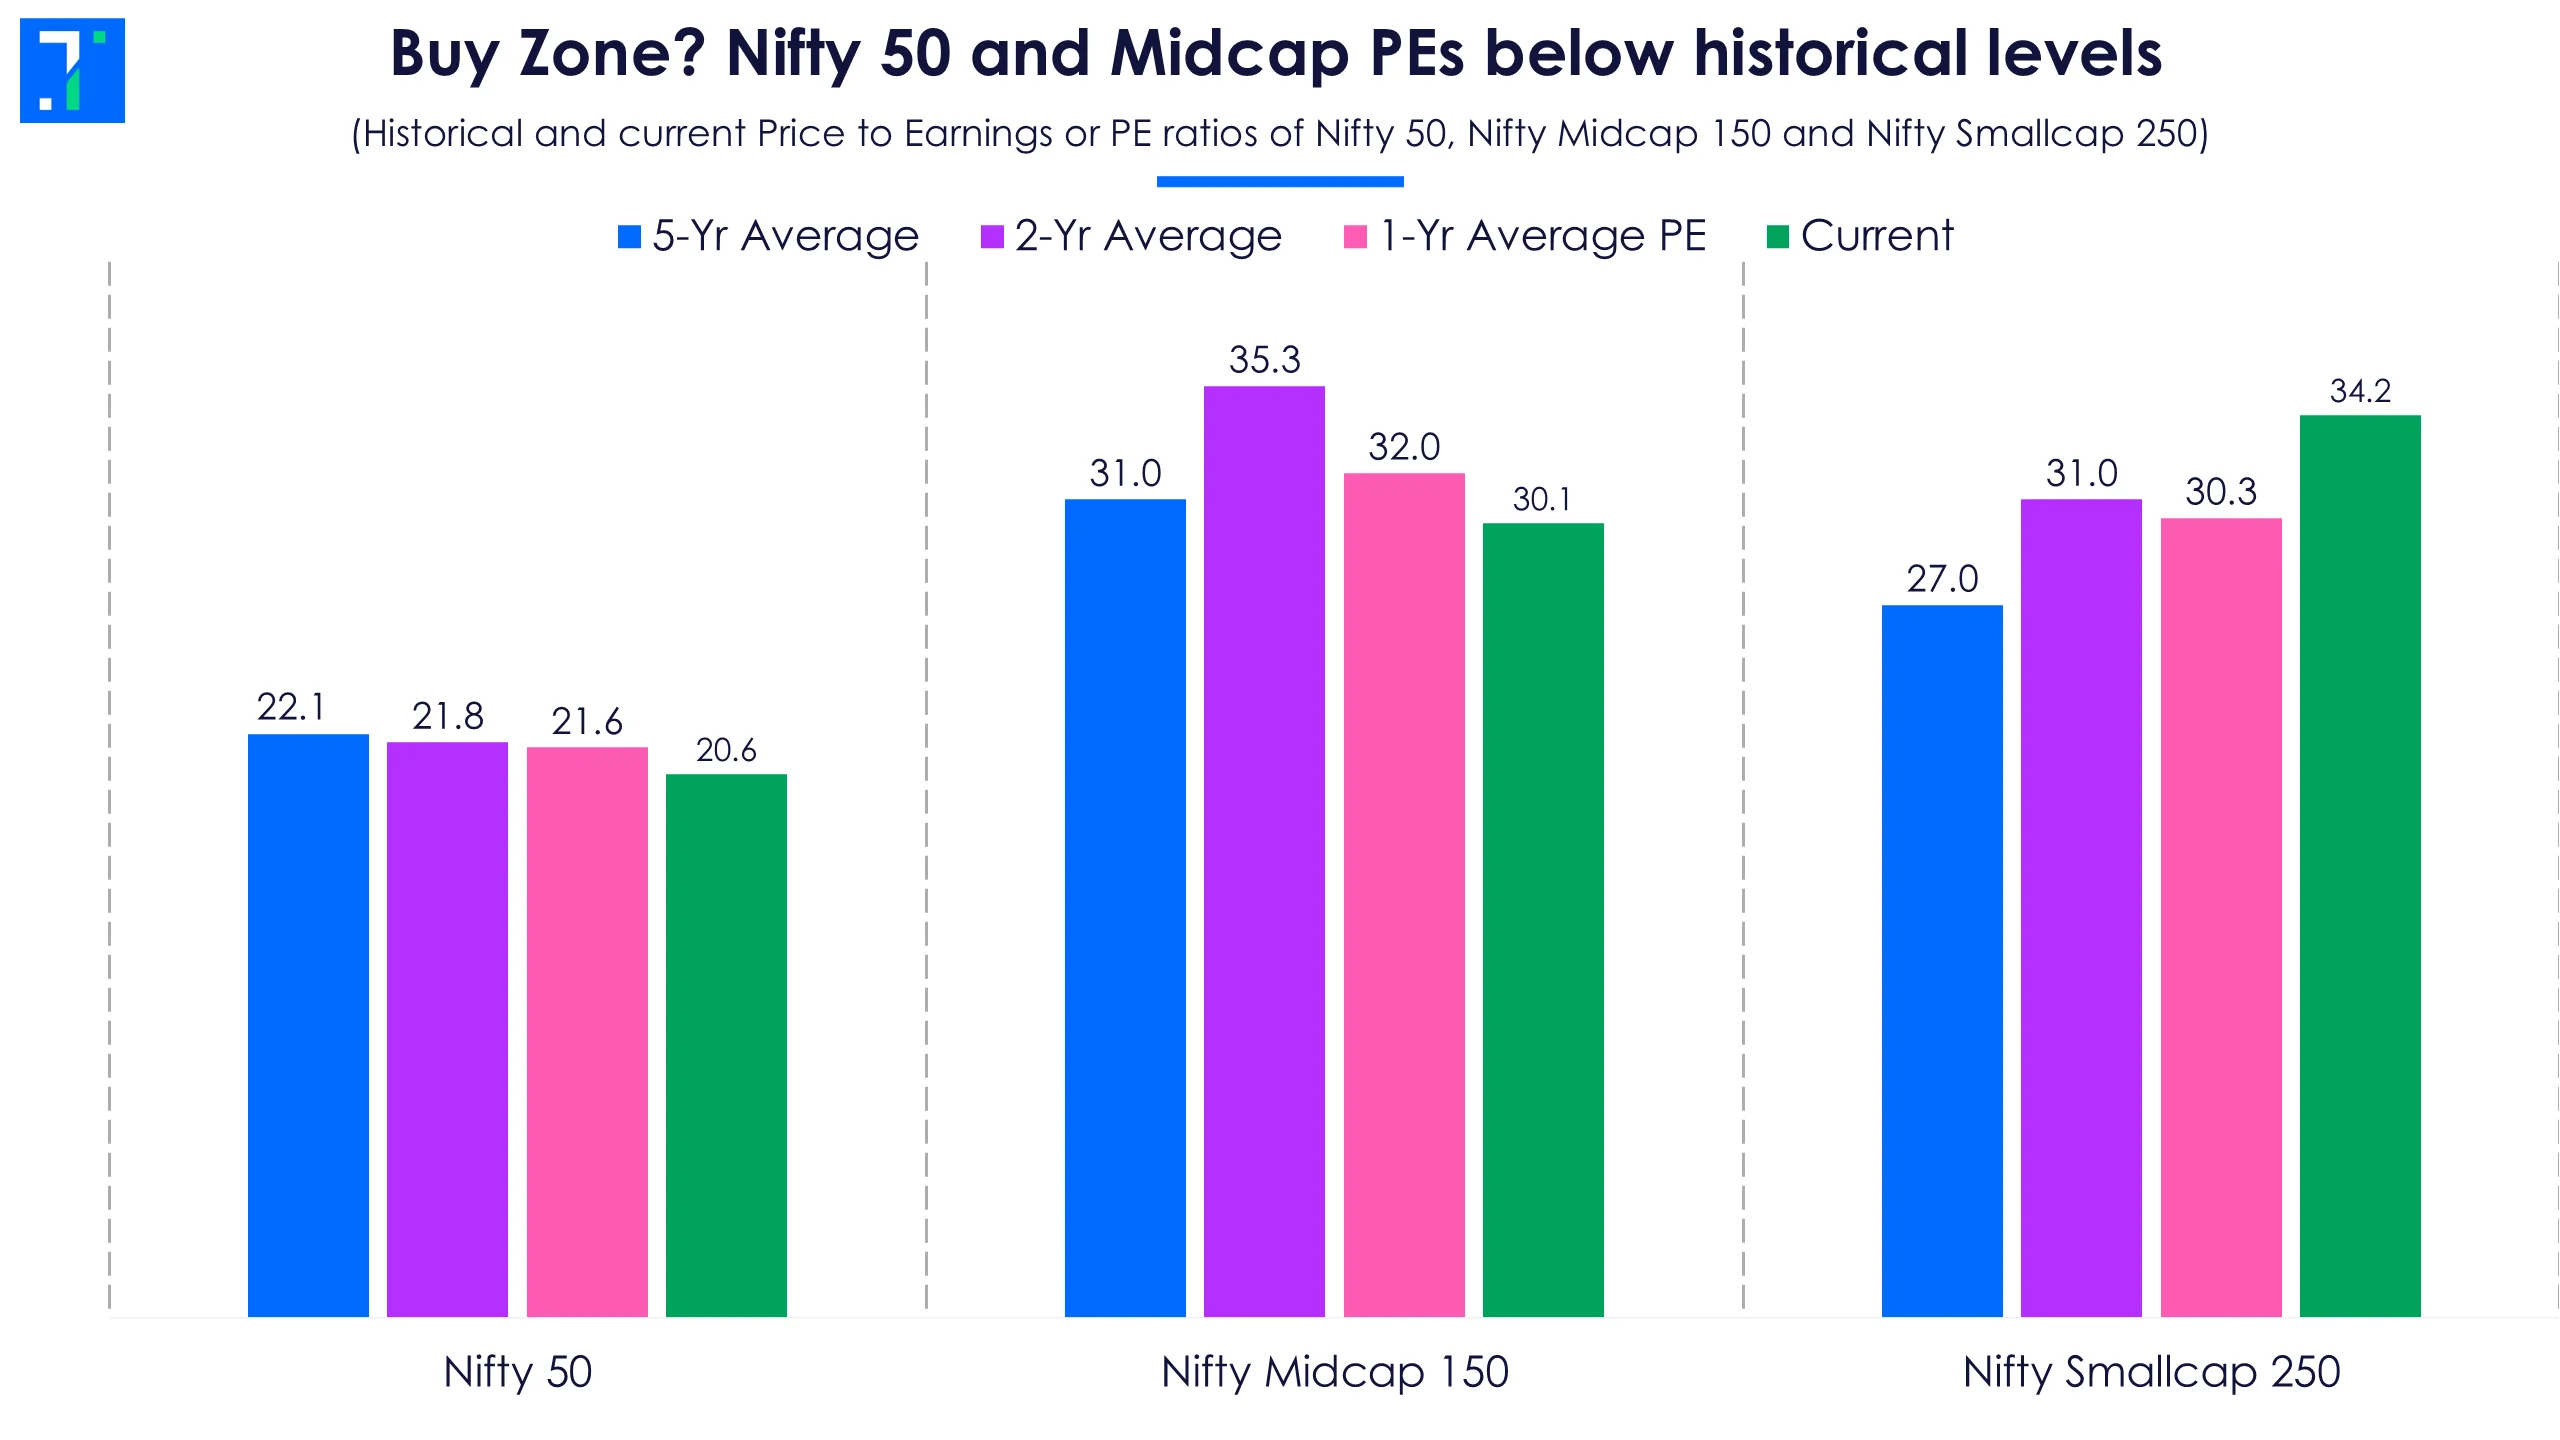
Midcaps continue to hit new highs, even though they trade below their historical average PE. They remain more expensive than the Nifty 50, while smallcaps look even pricier, with their current PE still above all three historical averages.
Sachin Bajaj, Executive Vice President and Chief Investment Officer at Axis Max Life, says, “Valuations of Indian markets at 19.7x FY27E and 17x FY28E are trending below long-term averages.”
Nifty Midcap 150 and Nifty Smallcap 250 may have done better over the past year, but the Nifty 50 now offers a more attractive valuation. Closing the gap will depend on Nifty's heavyweight stocks rediscovering their mojo.
