

The recent Ambani wedding - of their youngest son Anant - was a media event that seemed impossible to avoid. It wasn't just the tabloids and the TV channels that were doing what felt like round the clock coverage. Even the business dailies couldn't stay away. There were so many questions: did the bride plagiarize her speech? What shoes did Nita wear to the sangeet? Etc.
One eye-catching moment was completely unchoreographed. It was Meta CEO Mark Zuckerberg and his wife admiring the bridegroom's $1M Richard Mille watch. The tweets and articles this moment alone generated, is a symptom of our current billionaire obsession.

My mother used to say that it is unseemly to count other people's money. Here however, I have a good reason for doing it. Recently, some economists like Adam Tooze have made the argument that billionaires shouldn't exist. The inequality that results from the oversized share billionaires have over a country's resources, they argue, damages the economy, and results in much fewer resources for the rest of us.
In this week's Analyticks:
How big - and damaging - is India's wealth divide?
Screener: The highest and most consistent dividend stocks
Let's do some counting.
How big is India's wealth divide, really?
Those of us who live in urban India are used to seeing slum towns in one area of the city, and fancy gated communities with several swimming pools on the very next road. It is also something that visitors to India love to talk about as evidence of our high inequality levels.
But in reality, India is not as unequal as some other countries in share of wealth.

A troubling sign however, is when we look at annual incomes rather than wealth. Here, the share of India's richest is far higher than countries like the US and China. The top 10% of Indians are cornering a big share of national income every year.

The average annual income in India is just around Rs. 2.34 lakh -- a pretty small number. But the divide between the top 1% and everyone else is pretty large. And the top .001% of the population eclipses even them.
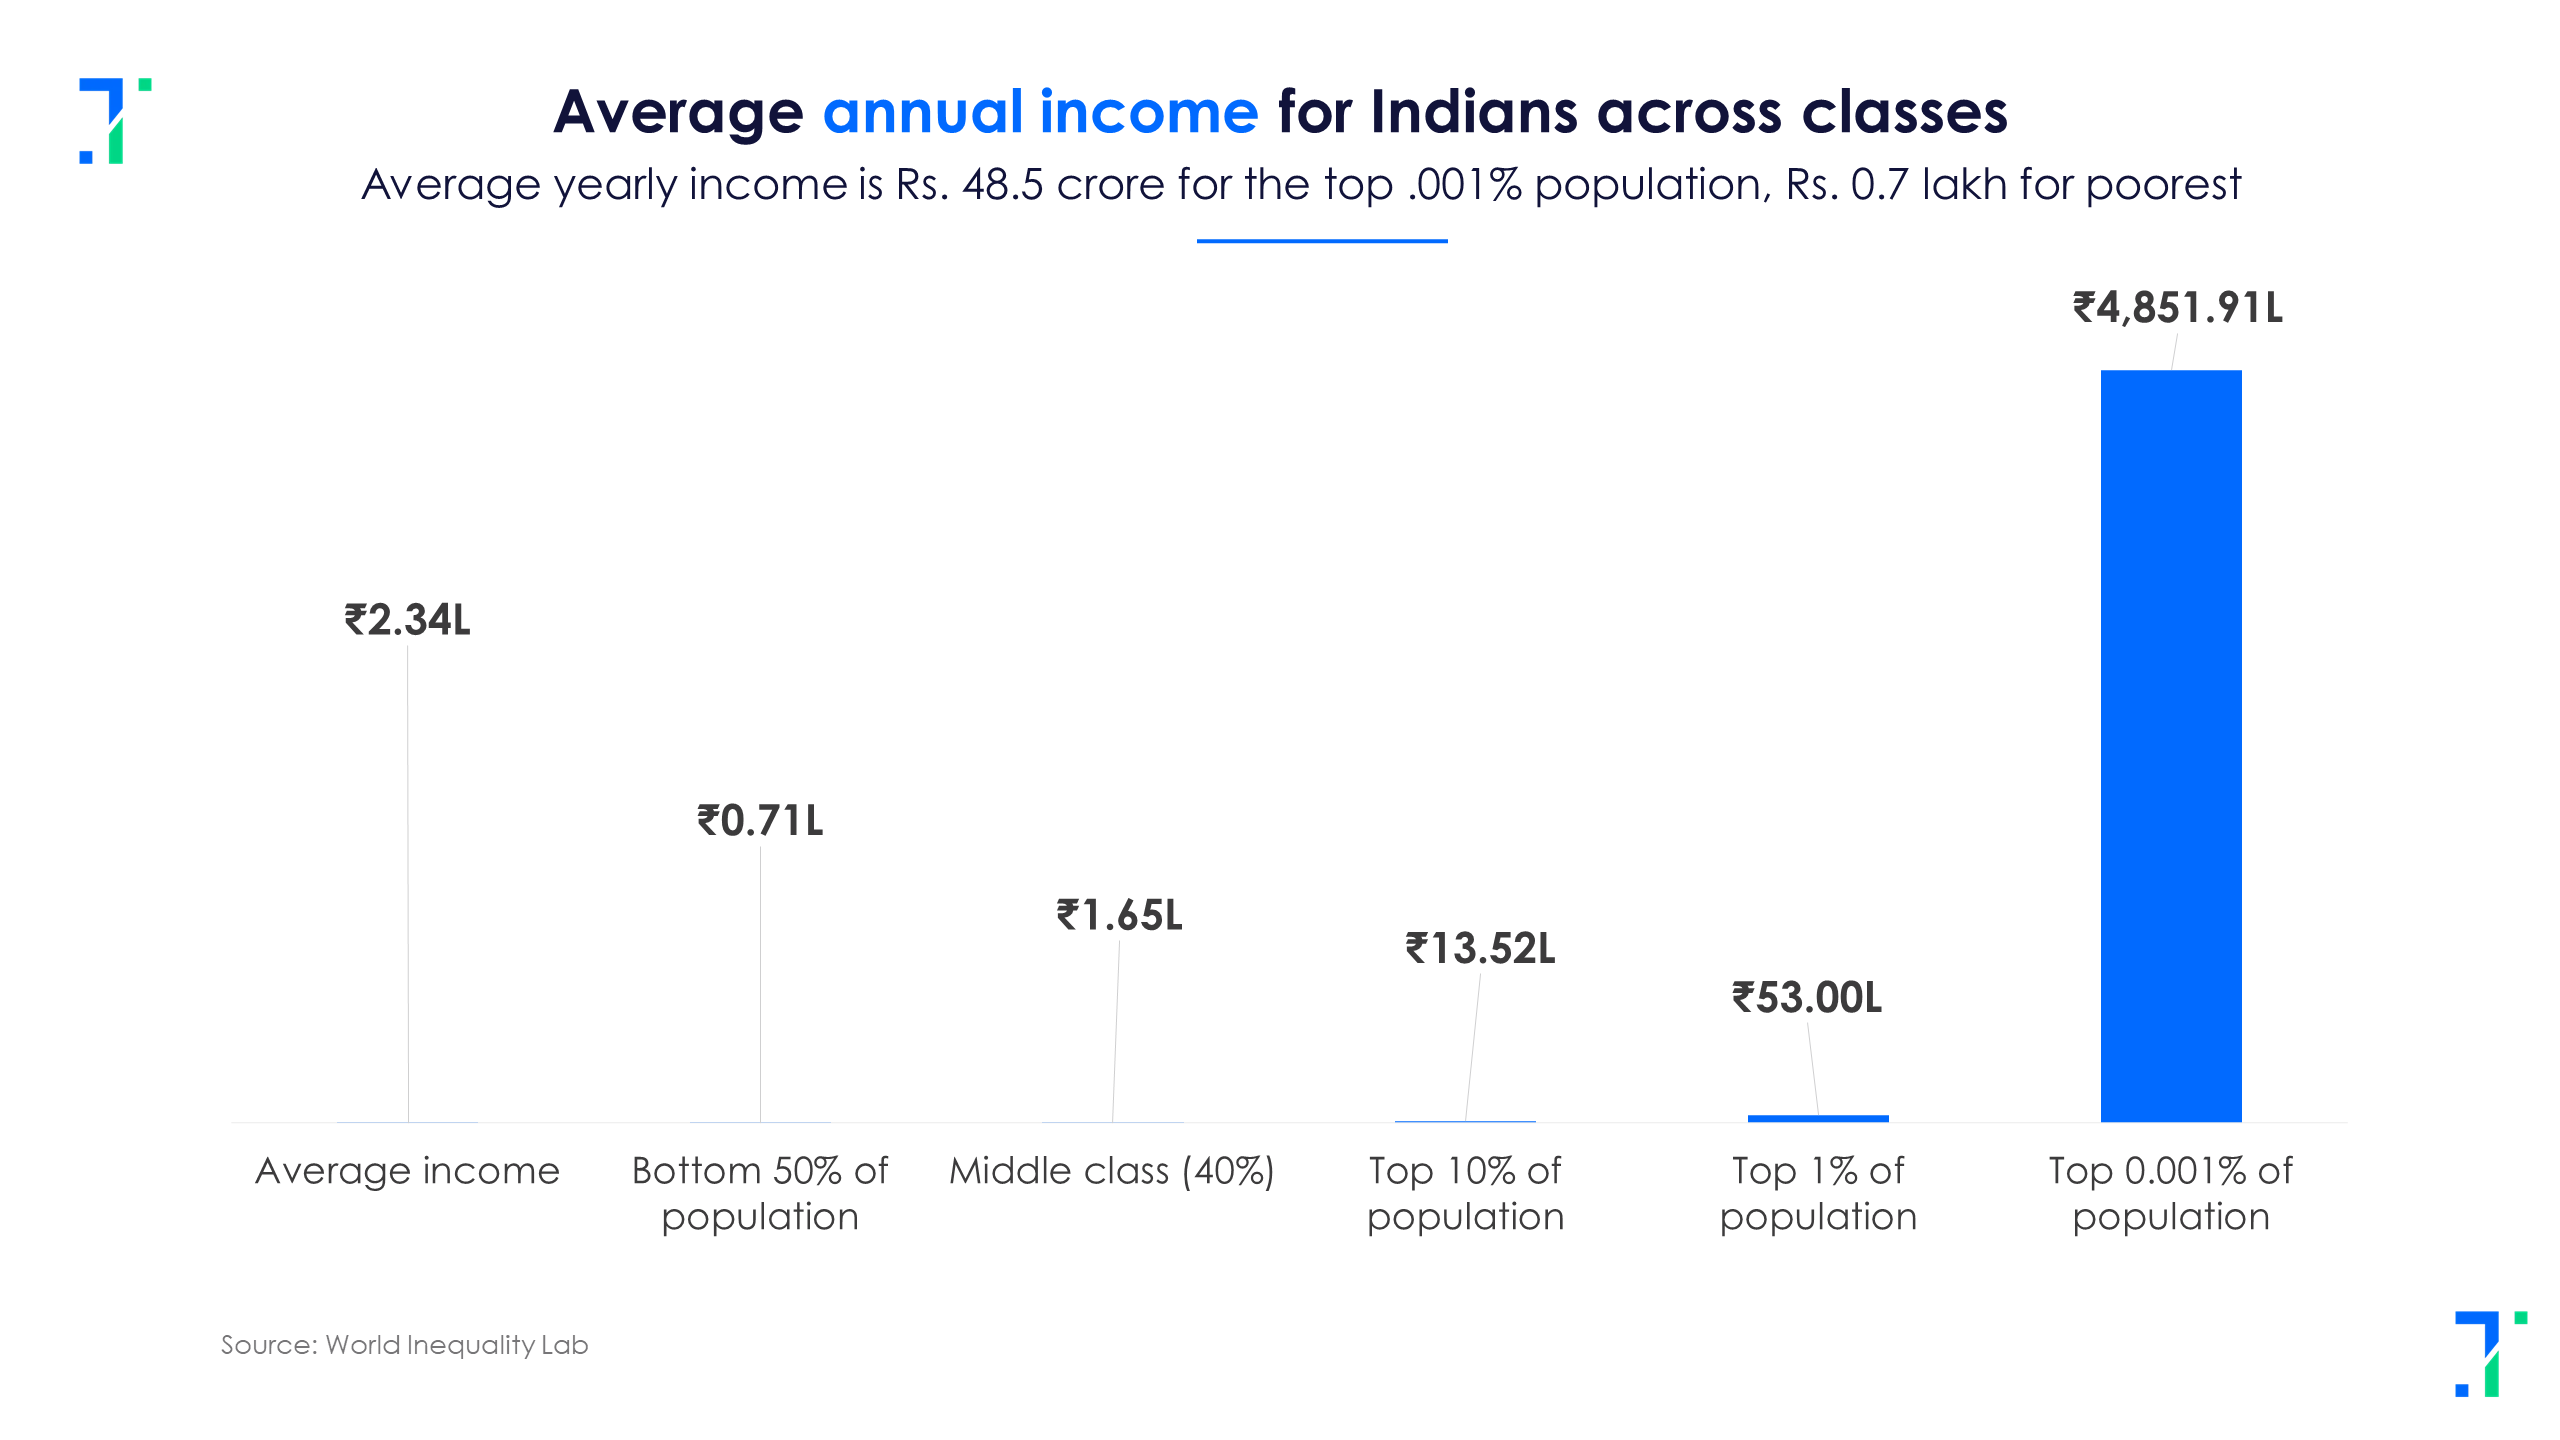
India’s richest 1% people have 22.6% of our national income, the highest in over a century .
Indians tend to invest most of the money that they make in land -- land and buildings together are 90% of Indian household wealth. This percentage hasn't changed much in 60 years. The share of financial assets for Indian households has increased from 4% in 1981 to around 10% today. When we look at total accumulated household wealth, the class divide is large.

The wealthiest 10,000 individuals in India own on average, assets of Rs. 2,260 crore each (Rs 22.6 billion), or 16,763 times the wealth of the average Indian. These are the people wearing Mielle watches, Lora Piana sweaters and taking chartered flights. For this group, queuing up for a first class seat on a commercial airline means failure, not success.
India's wealth divide didn't start with any one government
The vast accumulation of resources by a small group of people did not happen with one government, or in a few years. The problem of the Indian middle class steadily losing out, and the top 10% getting richer has been happening since the early 1990s. No Indian government from any political party has so far, been able to pause this.

Some of the wealth gains for the top 10% and top 1% of the population, has been driven by the stock markets -- the Sensex for instance, has grown by 7300% between 1990 and 2023.
But a group cornering more resources is a self-fulfilling problem, since they use these resources and influence to get even more. This means that over time, the influence of the top 1% on policies, governments and even elections become disproportionately high.
In India, we see this skew everywhere. In the stock market, just 32% of listed companies -- 1,700 companies -- have a market cap of over Rs. 500 crore. Both market capitalization and profits are skewed towards the largest conglomerates in India.
The rise of these billionaire entrepreneurs means they are busy influencing policy in every aspect of the government, and attempting to push out competition in entire sectors - telecom, power, gas, retail etc. Tariffs that benefit companies and promoters but hurt consumers have been on the rise. Subsidy policies disproportionately favour large corporations over SMEs, like PLI schemes.
To tackle the problem we must first acknowledge it. For example, economists have pointed out that a wealth tax of just 2% on the total net wealth of the 162 wealthiest Indian families in 2022 "would have provided revenue equal to 0.5% of the national income -- more than twice the central government’s budget expenditures on the NREGA".
A wealth tax is nothing new and has been implemented even in Ancient Greece, when the 'eisphora' wealth tax was levied on the richest 4% of the Athens population. A practical wealth tax would tax liquid assets above a certain threshold, the enormous amount of wealth that is idle and "trapped" in bank accounts. But this is just a beginning. For these curves to really shift, we must start the conversation.
Screener: High and consistent dividend yield stocks

PSUs lead in 3-yr dividend yield %
This screener shows stocks with high and consistent dividend yields over one, two and five years. It features the top 10 stocks with the highest dividend yield in the last three years. These companies have also outperformed the Nifty 50 in the past year.
The screener excludes stocks that have given a very high one-time/special dividend in the past two years. A high one-time dividend can inflate historical dividend yield, and such stocks may not be consistent high dividend stocks.
The screener is optimised to show 10 stocks with high 3-year dividend yield %. Seven of the 10 stocks currently in the screener are from the public sector. Major stocks that appear in the screener are Vedanta, Coal India, ICICI Securities, Power Grid Corp of India, Oil & Natural Gas Corp and Power Finance Corp.
FY24 has seen an increase in government budgets, contributing to growth in stock prices for these public sector companies. These public companies also have to give out a certain percentage of dividends every year – according to government guidelines, all public sector companies must give out at least 30% of their net profit or 5% of net worth (whichever is higher) for annual dividends. As a result, they tend to dominate the screener. Non-PSU stocks in the screener are ICICI Securities (capital markets), Tech Mahindra (IT consulting & software) and Gujarat Pipavav (marine port & services).
This screener also appears in Starfolio’s free featured baskets. This basket is great for long-term investors looking for high dividend-paying companies to generate passive income. This particular basket was created on March 10, 2023, with an annual rebalancing frequency. Its latest rebalance was on May 3, 2024, and the next scheduled one is on May 1, 2025. Each stock in the basket holds an equal weight of 10%, with seven being large-cap and three mid-cap stocks.
Since its creation, the basket has given pretty impressive returns of 249.1% (not including dividends) over the past 14 months. The basket outperformed the Nifty 50 index by 221.3 percentage points in the same period.
You can find more screeners here.
