What Trendlyne does
Trendlyne is a trusted investing engine used by regular investors, as well as analysts and brokerages nationwide. It tracks the quality of stocks through its automated system, and provides screener strategies and tools that can potentially maximize your returns.
The unique features on Trendlyne include a) the backtested, powerful DVM Score (Durability, Valuation and Momentum). DVM Scoring helps an investor make better stock selections, and avoid the worst stocks b) Stock Screeners that can be built from over 1000 parameters c) Backtesting that allows you to check the returns on any screener query you write and d) Powerful insights for stocks and portfolios, through portfolio products, Discover and the News engine.


DVM Scores
Every stock gets three trademark metrics: Durability, Valuation and Momentum (DVM). Stocks are ranked from 0 (worst) to 100 (best) on each score. This score helps the investor refine the stock universe which is researched with a quick understanding of the overall health of the stock.
-
Durability: The Durability Score is based on the quality of a company’s financials, its long term performance, and the quality of management. Durability scores above 55 are considered good(G) and below 35 are considered bad(B). Scores between 35-55 are considered neutral/Medium/Middle(M). Stocks with a high durability score (top 20 percentile) are companies that have consistently and over time, demonstrated good growth and cashflow, stable revenues and profits, and low debt.
-
Valuation: The Valuation Score tracks how expensive the stock is versus is peers. Valuation scores above 50 are considered good(G) and below 30 are considered bad(B). Scores between 30-50 are considered neutral/Medium/Middle(M). Stocks with a high valuation score (top 20 percentile) are companies whose business and financial advantages have not yet been priced into their share price. These companies typically have strong earnings but are currently flying under the radar, and Trendlyne’s valuation score helps shine a spotlight on these companies. Firms with a low valuation score (bottom 20 percentile) are expensive stocks that already have their strengths priced in. They are popular but pricey. If you are buying them now it would be for a steep price tag: valuation scores help you identify that.
-
Momentum: The Momentum Score tracks the bullishness or bearishness of a particular stock relative to the entire stock universe. A Momentum Score above 59 is considered good(G) and below 30 is considered bad(B). Scores between 30-59 are considered neutral/Medium/Middle(M). Momentum score or momentum score identifies the bullish/bearish nature of the stock. Stocks with a high momentum score (which is calculated daily from over 30 technical indicators) are seeing their share price rise, and increase in volumes and sentiment.
Stocks that are green on all three DVM metrics are rare because of the fairly stringent score. Stocks that score high in durability, valuation, momentum, as well as across the DVM, significantly outperform the index.

Image 1: Classification of Stocks based on DVM Scores
Using Stock Screeners, and Creating your Own
Stock Screeners allow users to filter stocks using specific queries. Users can for example, build Stock Screeners from 1000+ parameters, to find stocks with specific technicals, financial performance, that show red flags like unusual swings in loss and profit, and so on. The Stock Screeners update automatically as the metrics change.
Examples of different Stock Screeners:
-
Advisor screener tracking for Broker price or reco upgrades in last month: With this screener and query, the user is able to find a list of all stocks that received broker price or recommendation upgrades in the past one month. Query for this screener: Broker 1M Target upgrade >= 1 OR Broker 1M Reco upgrade >= 1. This is a pre-built screener on Trendlyne. Users can customize the screener to their watchlist or portfolio by duplicating this screener. View all Advisor/Broker Stock Screeners.
-
Live Result screener tracking forCompanies that announced results in last two weeks: This screener looks at all stocks that announced results in the last two weeks, with rising operating profit margin and YoY profit growth. The screener tracks live results as they come in. Date fields are used in this query to filter by date. Query for this screener: Result Declared date yyyymmdd >= Today Minus 2Week AND Operating Profit Margin Growth YoY % > 5 AND Net Profit Qtr Growth YoY % > 5. To save this screener or run a query of this, the user needs to have subscription. View all Live Result Stock screeners.

Image 2: Example of Live Results Screener
-
Technical screener tracking such as Negative Breakdown First Support: This screener is based on the technical query used to get the list of stocks seeing a negative price breakdown below the first support. The query used in this is as follows: Current Price Rs < First support S1. The user can copy or make a duplicate of this query to include it in their watchlist. See Technical Stock Screeners.
-
Shareholding screener tracking forhighest promoter stock pledges: This screener finds stocks with the highest promoter pledges. Promoters pledging their stocks is considered negative for the stock. Promoters may pledge their stake in a company to raise loans, collaterals, personal needs or for another venture. If the stock price keeps falling, the value of the pledged stock may fall below the collateral required, triggering a ‘margin call’, and stocks whose price have fallen and have high pledges are more susceptible to such ‘margin calls’. The query used in this screener is: Promoter holding pledge percentage % Qtr > 0 AND Shareholding Date yyyymmdd = Previous Quarter Date. The user can copy or make a duplicate of this screener to include it in their watchlist. See Shareholding Stock Screeners.
-
Stock Screeners that combine DVM Scores with Different Parameters: DVM scores can be combined with different parameters to identify quality stock picks. For example: a query can be created that combines Trendlyne DVM Scores and Piotroski Score.
Another example is a query that looks for stocks in the top 25% of equity universe in technical momentum, which have shown good profit and revenue growth over the past four quarters. To create a screener for this, the query used was Revenue growth TTM % > 15 AND Net Profit TTM Growth % > 15 AND Trendlyne Momentum Score > 70. This screener changes as financials come in, and as momentum changes.
How to Link a Screener with Watchlist
If an investor is interested in an already existing screener and wants it to filter only for stocks in their watchlist, OR created a new screener and wants it to filter only for stocks in their watchlist, the process is as follows:
Link an Existing Screener with a Watchlist/Portfolio
-
Click on the screener you are interested in. For example, ‘Broker price or reco upgrades in last month’.
-
Click on ‘Filter’ to see the list of stocks in your watchlist/portfolio.
-
If you want to permanently link this screener to your watchlist, click on ‘Duplicate this Screener’.
-
Select your watchlist from the Filter dropdown, and save the screener as your own.
-
If you want to receive alerts for this screener watchlist, click on ‘add alert’ and select the duration of the alert you prefer.
Link New Screener with Watchlist/Portfolio
-
Click on ‘Stock Screeners’ tab on Trendlyne website
-
Click on ‘Create New Screener’ and enter the query from different parameters and by entering the details mentioned in ‘How to Create Stock Screeners’ on this page number 2
-
In the Step 2 of creating New Screener, you get an option to ‘Select your preferred default stock universe (optional)’ in which you need to select ‘Your Watchlist’ or Portfolio and click on Save & Finish. This automatically links the screener to your watchlist.
-
These screener linking features are also available for ‘All Your Watchlists’, ‘All Watchlists and Portfolio’.
How to Create Multiple Watchlists
Any subscriber can create as many watchlists as they like. Multiple watchlists are useful for users to track different types of stocks. For example, a user may have two watchlists, such as Long Term and Short Term. How to create a watchlist and multiple watchlists:
-
Click on Portfolio
-
Click on Watchlist from the tabs in Portfolio section
-
On the top right of the page, choose the icon for ‘Create new Watchlist’.
-
Give a title in the ‘Watchlist Title’ box. You can also add a ‘Watchlist Description’ and click on Submit

Image 3: Create New Watchlist
-
Add the stocks you prefer in the watchlist. By searching for the stock in the ‘ADD TO WATCHLIST’ box, it will automatically get added as you select the stocks. You can add multiple stocks in one particular watchlist
-
In the same way one watchlist was created, users can create multiple watchlists with different names.
-
The user can view all watchlists created by them in ‘SELECT WATCHLIST’ box. In this all the different watchlists with different names created by the user is available. There is another option of ‘All’ in this same list which when selected, will show all the stocks from all the different watchlists

Image 4: Select Stocks & Watchlist from multiple watchlists
How to set a Screener Alert on any Screener
By setting a screener alert, an investor gets all the entries and exits of stocks in the screener. To set a screener alert, click on any screener. On the right-hand top corner, click on the bell icon to set a screener alert. The same process can be followed in any screener to set a screener alert.

Image 5: Screener alert on any screener
How to Run a Screener on any Watchlist or Multiple Watchlist
Trendlyne provides this unique feature to its subscribers to run a screener on any watchlist or multiple watchlist. Here are the details of the process of how to run a screener on any watchlist:
-
Click on ‘Stock Screeners’
-
Click on ‘Create New Screener’
-
Enter the query as per different parameters available and as per your requirement and click on ‘Try this query’
-
Click on ‘Next: Step 2’
-
Add rest of the details mentioned in the page 2 of creating new screener. In this page, there is an option to ‘Select your preferred default stock universe’. In this option, you can go and select any particular watchlist on which you want to run this screener
-
In the same option, you get an option of ‘All Watchlist’. Click on ‘All Watchlist’ to run the screener on all your watchlist and then click on ‘Save & Finish’
Creating your own Screener
Stock Screeners help investors choose stocks based on specific kinds of parameters. with good DVM scores for investment. Pre-built DVM Stock Screeners with strong returns are here and here. Here is a stepwise process to create your own DVM Screener:
-
Click on Stock Screeners tab
-
Click on Create New Stock Screener
-
You can scroll through the parameter list or write the parameter you want in the ‘Write Query’ box, to see suggestions as a drop down.
-
Example: If you want to check for stocks which are strong financial performers but are getting expensive i.e. stocks with high durability and momentum score whose valuation is getting expensive, you can write this query: Trendlyne Durability Score > 55 AND Trendlyne Valuation Score <= 50 AND Trendlyne Valuation Score > 30 AND Trendlyne Momentum Score > 60. You can also combine DVM with other parameters.
-
Click on ‘Try this Query’. All the stocks which qualify in the query will appear.
-
You can keep modifying the query to see what kind of stock results you get. Once you reach a result you like, you can save this as your screener. Click on ‘Next: Step 2’.
-
Give this screener a name in the ‘Title’ section. If you want to make it public, tick the ‘Make Public’ box. By default, the box is unticked, meaning it will be visible only to you.
-
Add a little bit of description about the screener in the ‘Description’ box. This is optional.
-
If you want to add more columns in the chart to view, click on ‘Select column to add’ and select any of the parameters you need.
-
The investor can also select a particular group of stocks from ‘Select your preferred default stock universe’. This feature is also optional. You can choose an index (like Nifty500), a sector (like FMCG), or your portfolio, a specific watchlist, or all your watchlists.
-
Click on ‘Save and Finish’. The page will automatically direct you to the screener you have created.
-
If you want to add alerts for this Screener, click on the alerts (bell) icon present on the right-hand side corner of the Screener page.
-
The investor can also run a backtest to check the performance of the stock in the past by clicking on the second icon, right of the bell icon.
-
If you want to edit the screener or add new parameters at any given point in time, click on ‘Edit this screen’ icon present to the right of the alerts (bell) icon. You can change the name, add description, add more parameters, add another group of stocks as per your requirement. The investor can also add more parameters in the query and update it to get a fresh list of stocks, and click on ‘Update & Save’, once done.
How to Run a Backtest on any Screener
Running a backtest helps investors find high return investing strategies. Backtesting shows the previous returns of stocks selected from a particular screener query. It also provides detailed returns for each period, and stock entries and exits:
-
If you are a subscriber, you can run a backtest on any screener strategy including the prebuilt strategies or Stock Screeners.
-
For a backtest on a Prebuilt Screener, click on the screener on which you want to run the backtest, and clone the screener.
-
You will see the same screener query copied into a new text box. The text box is editable because of which you can change the numbers and metrics around if needed. You can rename it and click on Save to have your own screener and to run a backtest.

Image 6: Clone Screener to Run backtest on system screener
-
Once you have cloned and saved the screener, you see three icons on the top right-side of the page: the bell (for setting alerts), the clock (for backtests) and delete (to delete the screener). Click on the clock to ‘See Backtests’ or Run a Backtest.
-
Choose Date Range and Frequency for the backtest. In Portfolio Review Frequency, you can select how often you want the query to be tested against the stock universe. This can be daily, weekly, monthly, quarterly, half yearly and yearly (longer-term strategies can be backtested quarterly/half-yearly/yearly. Short term trading strategies can be backtested daily/weekly).
-
In the Start Date field, select the date from which you want to start the backtest and mention the last date in the End Date field for when you want to end the backtest
-
You can choose a particular set of stocks from the Select Stock Universe, whether its an index, your portfolio or watchlist. Select the Benchmark - Nifty500 or other - as per your requirement
-
For more options, click on Advanced. Here you can choose the configuration for a particular parameter - for example choosing stocks that are highest on one specific query value. You can also limit the number of stocks selected each time.
-
Once all the options have been selected, click on Run Backtest

Image 7: Run Backtest on Prebuilt screener
How to Set a Stock Alert
When any investor has invested or is interested in a particular stock, a stock alert can be set on Trendlyne to get all the latest news and the performance of the stock in the market. Here is the step-wise explanation of the process to set general stock alerts:
-
On any stock page, there is an alert (bell) icon on the right-hand side corner. Click on the icon to set a stock-level alert and receive notifications.
-
The user gets an option to select different parameters as per their requirement. The alert can be set for daily, weekly or monthly changes in a stock’s performance.

Image 8: Stock Alert
How to Set a Superstar Alert
For users interested in the investments of large investors, ie superstar investors, an alert can be set for superstars. Once the alert is set, you will start receiving mail when any changes in the portfolio or deals of superstars is observed. How to set a superstar alert:
-
Click on Superstars tab
-
Click on ‘Add Superstar Alert’ box.
-
In the ‘Modify Alert’ the user has an option to choose daily alert or weekly alert.
-
There is a 100+ list of superstars covered in the Superstar Alert. Click on ‘View all superstars covered by this alert’ to have a view of all the superstars listed. Users get one email/notification summarizing all the changes made by various superstars.

Image 9: Add Superstar Alert

Image 10: Superstar Alerts
How to Analyse Multiple Portfolios
The portfolio can be analysed in the ‘Portfolio Analysis’ tab on Trendlyne. There are seven different parameters based on which the portfolio can be analysed which are as follows:
-
CONCENTRATION ANALYSIS: This feature enables an investor to see how diversified their portfolio is between various sectors and stocks. Over-concentrating the portfolio in very few sectors puts the portfolio more at risk. Here’s the process to generate report in Concentration Analysis:
-
Select Account and Date: In the ‘Select your account’ section, the user can choose any account in the portfolio that they may be interested in generating report. The next column is ‘Select Date’. Any date and year can be selected on this report.
-
Edit Columns to display in charts: The user can select any parameter based on which they want to generate the report from this section.
After adding all these details, click on Generate Report. Three different charts will show up below the query section, Market Value on Date (Rs Lakhs), Cost Value on Date (Rs Lakh) and Unrealized Profit Value on Date (Rs Lakh) for your portfolio. By default the concentration shown is By Stocks, By Sector and By Industry. The chart by default shows the pie-chart which can be changed to tabular graph or bar graph as per the user’s requirement.

Image 11: Concentration Analysis Tab View
-
DECISION ANALYSIS: The Decision Analysis tab has three different sub-sections, Buy Decision, Hold Decision and Sell Decision. A detailed look at these:
-
BUY DECISION ANALYSIS: This looks at the quality and timing of stocks purchased by the user. It clusters the buy decisions for every financial year and segments them by returns generated. The analysis gives an insight into optimum holding periods of the user and the percentage of buy decisions returning more than 15% returns (or a % selected by the user). The user just needs to select the account name and the starting financial year to generate the report and see the buy decision analysis.

Image 12: Buy Decision Analysis Tab View
-
HOLD DECISION ANALYSIS: This looks at the quality of the Hold Decision of the user. It analyses the returns generated at the stock level across time periods to check whether the calls made by the user to hold the stock were good or bad. It benchmarks the return given by stocks over financial years and CAGR for the past three years against a desired sum of 15% (the user can change the desired % based on their preference). Stock returns and time periods are highlighted in red if the return doesn’t meet the desired %. To generate this report, select the portfolio account and the starting financial year and click on Generate Report.

Image 13: Hold Decision Analysis Tab View
-
SELL DECISION ANALYSIS: This enables a user to see how stocks performed after the user sold them. Sell Decision Analysis lets the user know if the stock was sold too quickly or too late, if the stocks sold out-performed or under-performed the market after selling them and insights on the timing of the selling decision of the investor.

Image 14: Sell Decision Analysis Tab View
-
PORTFOLIO NAV: The performance of stocks in the portfolio is key for any investor. The Net Asset Value (NAV) calculates the market value of the user’s portfolio for a given period of time, after adjusting for losses as well as dividends. Through this Portfolio NAV feature, the user can generate their own NAV and choose an index including stock indices, mutual funds and other investments to the chart to compare performance.

Image 15: Portfolio NAV Chart View
-
ROLLING RETURNS: Investors can look at the performance of their portfolio at any point in time using Rolling Returns. Users usually get biased by the most recent numbers when talking about performance but Rolling Returns of any user’s portfolio gives a clearer idea about the performance of the portfolio returns and excess returns as well. The user can add any index from the Select Index option to see the comparison. The user also needs to add the account name in Select Your Account and add duration in Select Duration and then Generate Report.

Image 16: Rolling Returns Chart View
-
GROWTH TREND: The Growth Trend analysis helps users/subscribers/investors analyse the growth of their portfolio as a whole. This is a weighted average of the growth of the companies in the user's portfolio over a period of time. It identifies the growth laggards and leaders. All that is needed to have a look at this report is to Select your Account and Date and then click on Generate Report.

Image 17: Growth Trend Tab View
-
VALUATION TREND: The Valuation Trend or the Long Term PE calculates share price of a stock as a multiple of the average earnings per share over several years. This is a safer, more cautious PE measure for investors compared to simple historical PE, since it considers the value of a stock over a longer period of time, limiting the effects of recent positive fluctuations.

Image 18: Valuation Trend Tab View
-
CALENDAR: With this feature, any user can check for upcoming and previous dividends, bonus/split, board meetings, forthcoming results in the Portfolio and watchlist stocks. The user needs to select the date range in Start Date and End Date, any of the Corporate Actions and Group of Stocks and then Generate Report in the Calendar section.

Image 19: Calendar Tab View
How to Create Multiple Portfolios
Any subscriber can create multiple portfolios as per their requirement. Here is the process to create multiple portfolios.
-
Click on Portfolio tab
-
The page takes you to the ‘Portfolio’ section directly on clicking ‘PORTFOLIO’
-
On the right corner of the ‘Portfolio’ page, click on ‘New Account’ to create a new portfolio
-
Give a name to the portfolio in ‘Portfolio Name’ box and add description if needed in the ‘Portfolio Description’ box and click on ‘Submit’
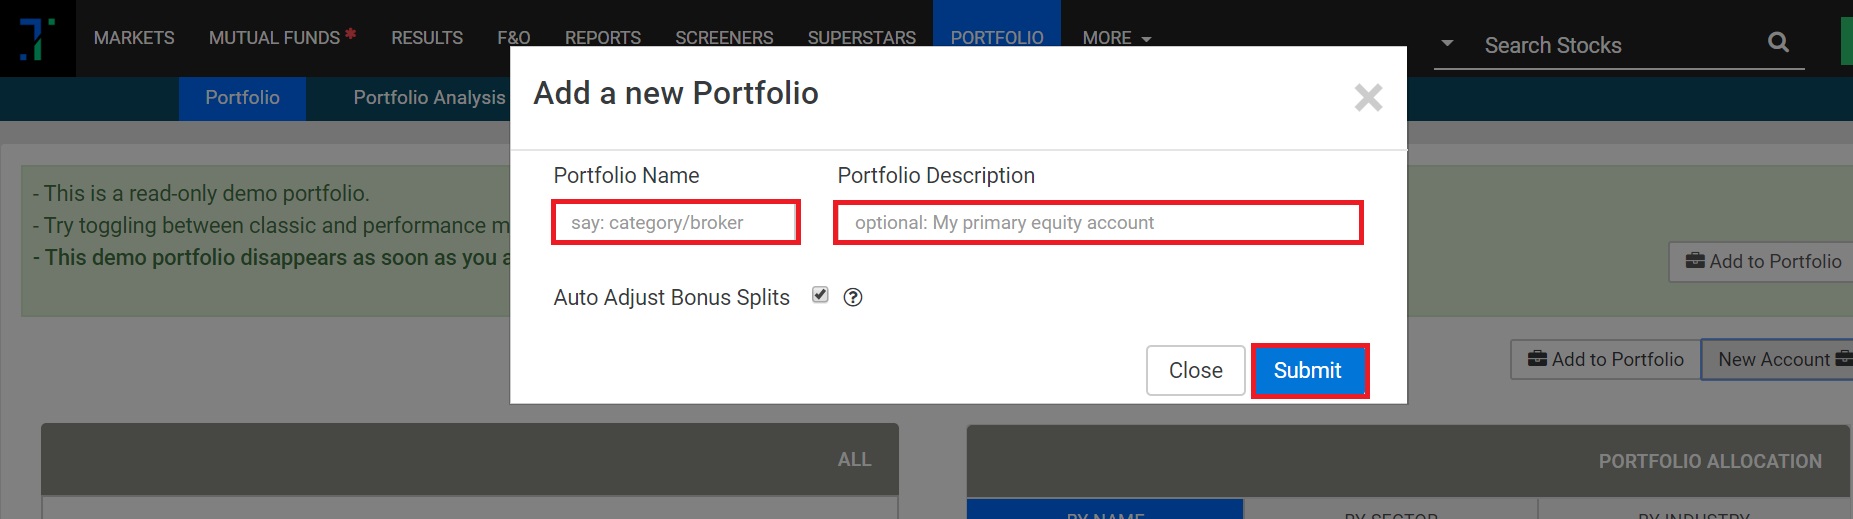
Image 20: Add Portfolio Name & Description
-
After you have created a new ‘Portfolio’, you need to add stocks to that particular portfolio. Click on ‘Add to Portfolio’ on the right corner of the Portfolio page. Select the name of the portfolio in which you want to add stocks from the ‘Portfolio’ box. Enter the name of the stock in which you have invested in the ‘Entity’ box, add the transaction date in the ‘Trans. Date’ box, add the number of quantities that you have invested in the ‘QTY’ box and the price for which you bought the shares in the ‘Price’ box.
-
If you want to add more details for your own reference, you can add that in the ‘Notes’ box and click on ‘Submit’

Image 21: Add stocks to the Portfolio
-
If you want to add stocks in a ‘Portfolio’ with different names, repeat the same process mentioned above
Additional Features
Trendlyne offers additional features to its subscribers, non-subscribers and investors which include ‘Results’ and ‘Mutual Funds’. Here are the details of both the features:
Results
The Results section of Trendlyne allows users/subscribers/investors to have a detailed look at the performance of stocks based on different parameters. All the companies which have declared results in the current quarter will be visible in this section. Here’s a walkthrough of Results:
-
FILTER: This feature can be used to choose the watchlist/portfolio/index, to go through the stocks listed under these parameters only based on the requirement or choice of the user. The user can choose different market cap stocks, future & options stocks, BSE Indices, NSE Indices and different sectors/industries stocks.
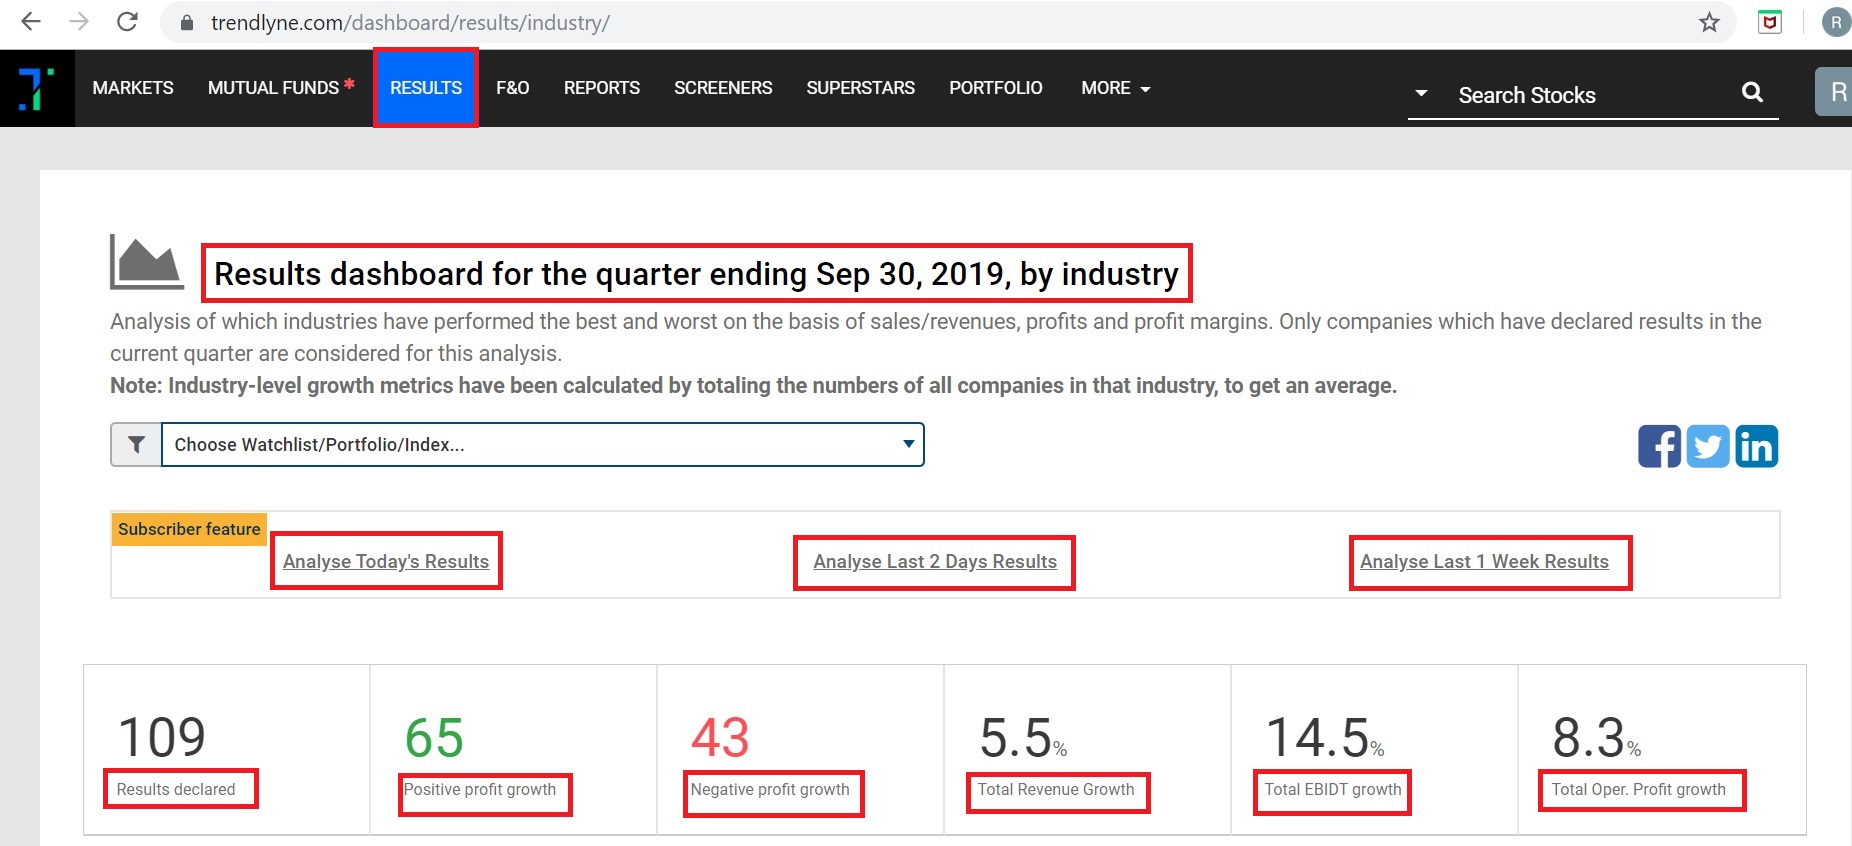
Image 22: Main Page View
-
Time based analysis of results as they come in: This feature is available only for subscribers who can login and use these functionalities. There are three different features for subscribers:
-
Analyse Today’s Results: If a user has a subscription, they can click on the link provided which provides results declared today as they come in.
-
Analyse Last 2 Days Results: This provides results which have come within the last two days. This page shows the complete and detailed analysis of stocks declaring results for the ongoing quarter in review.
-
Analyse Last 1 Week Results: A detailed analysis report of the stocks which declared results over the past one week. This feature offers a bird’s eye view of leader and laggard stocks, based on the performance for the last quarter end.
Users can also see at an industry level, the Number of Results Declared, Positive Profit Growth, Negative Profit Growth, Total Revenue Growth, Total EBIDT Growth and Total Operating Profit Growth. View All Industries
Industry-level charts which show the performance are also available. Users can click on any industry chart to see stock level result summaries, covering YoY Revenue Growth, YoY Net Profit Growth, YoY Operating Profit Growth, and so on.

Image 23: View of YoY Revenue Growth and link to click for All Industries

Image 24: All Industries View, when clicking on View All Industries

Image 25: YoY Profit Growth View

Image 26: YoY Operating Profit Growth View
-
Stock Screeners: Below the details of the industries on the main page, there are different Stock Screeners which are based on different parameters and shows different stocks as per different results. The user can also run backtest of these Stock Screeners to see the performance of stocks in the past.

Image 27: Stock Screeners View on the main page of Results
Mutual Funds
A type of financial vehicle made up of a pool of money collected from many investors to invest in securities is mutual funds. There are different types of mutual funds on which a user can invest. Users can analyze mutual funds via their goals, or find their favorite via the detailed mutual fund table.
Users can screen mutual funds via the Quick Filter button on the top right of the full table.
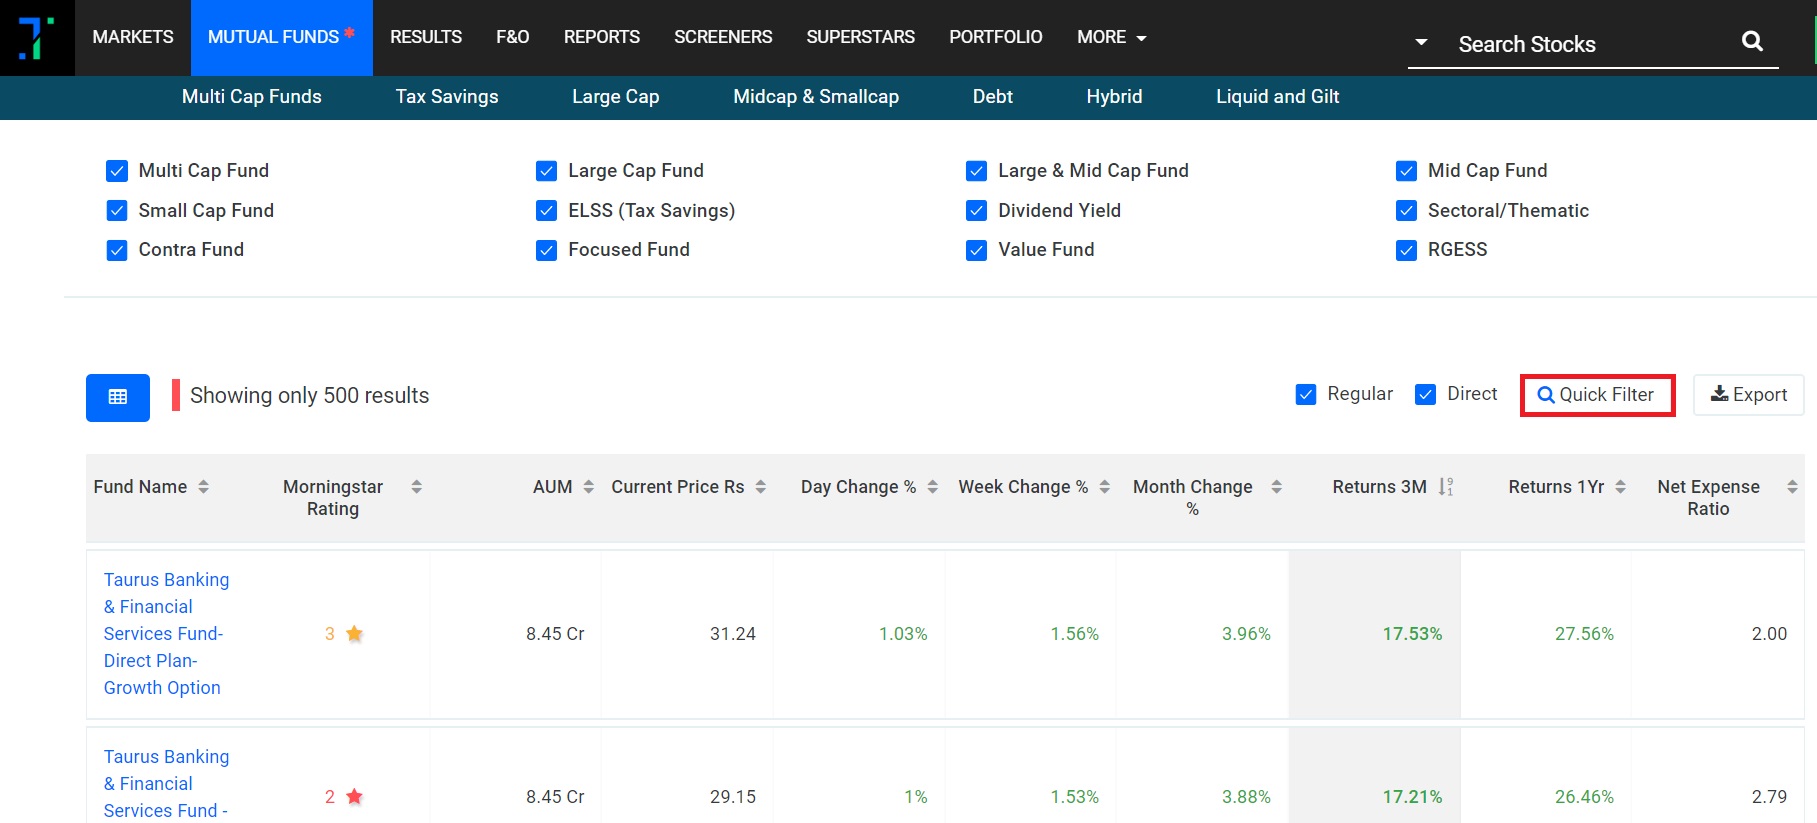
Image 28: Mutual Funds View Page