Free Stock Market Widgets from Trendlyne
Add Powerful Stock Market Tools to Your Website and App. Embed Widgets for SWOT, Stock Scores, and Stock Checklists. Copy and paste the line of code provided, and you are ready to go.

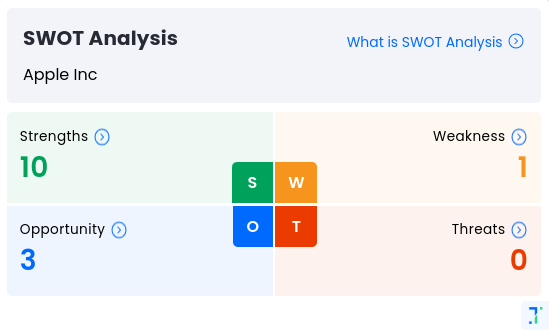

Harley-Davidson, Inc.SWOT Analysis
What is SWOT Analysis StrengthsWeaknessOpportunityThreatsWhat is SWOT Analysis ?These are then classified as strengths, weaknesses, opportunities that investors can leverage, and threats that might impact company health.
Strengths, Weaknesses, Opportunities and Threats Analysis is a real time check on stock health throughout the day. SWOT looks at financials, management quality, technical parameters and valuations to identify positives and negatives for every stock.
- Strengths
- Weakness
- Opportunity
- Threats
- Buy Zone: Stocks in the buy zone based on days traded at current PE and P/BV
- Significant (over 30%) distance from 52 week high
- PE less than Industry PE
- Relative Outperformance versus Industry over 1 Month
- Rising Net Cash Flow and Cash from Operating activity
- Relative Outperformance versus Industry over the Quarter (3 Months)
- PEG lower than Industry PEG
- Dividend yield greater than sector dividend yield
- Relative Outperformance versus Industry over 1 Month
- Affordable Stocks - Stocks with Good Trendlyne Valuation Score
- Company able to generate Net Cash - Improving Net Cash Flow for last 2 years
- Strong cash generating ability from core business - Improving Cash Flow from operation for last 2 years
- Book Value per share Improving for last 2 years
- Stock with Low PE (PE < = 10)
- Stocks Outperforming their Industry Price Change in the Quarter
- Bearish Stocks - Stocks with Medium to Low Trendlyne Momentum Score
- Inefficient use of shareholder funds - ROE declining in the last 2 years
- Inefficient use of assets to generate profits - ROA declining in the last 2 years
- Top Losers
- Near 52 Week Low
- Degrowth in Quarterly Revenue and Profit in Recent Results(YoY)
- Annual net profit declining for last 2 years
- Weak Momentum: Price below Short, Medium and Long Term Averages
- Recent Results: Declining Operating Profit Margin and Net Profits (YoY)
- Declining profits every quarter for the past 3 quarters
- Profit to Loss Companies
- Declining Revenue every quarter for the past 3 quarters
- Near 52 Week Low
- Top Losers
- Mutual Funds Increased Shareholding in Past Month
- Institutions increasing their shareholding
- Mutual Funds Increased Shareholding over the Past Two Months
- MFs increased their shareholding last quarter
- Mf buying for 2 months

What is QVTQVT Stock Score
Harley-Davidson, Inc.Quality 52 /100 Medium Financial StrengthValuation 62 /100 Affordable ValuationTechnicals 38 /100 Technically NeutralMid-range PerformerGoodAverageBad
